
Now that you know the lightweight approach on how to flash and debug (only using the console), you now understand that an IDE is not mandatory for embedded development.
However, most developers enjoy the ergonomics of a modern IDE. So let's go back to VSCode straight away!
In this tutorial, we will simply get the previous "Mr Robot - Hello, world!" example running from within VSCode.
1. Open the project
Open the parent folder of your project:
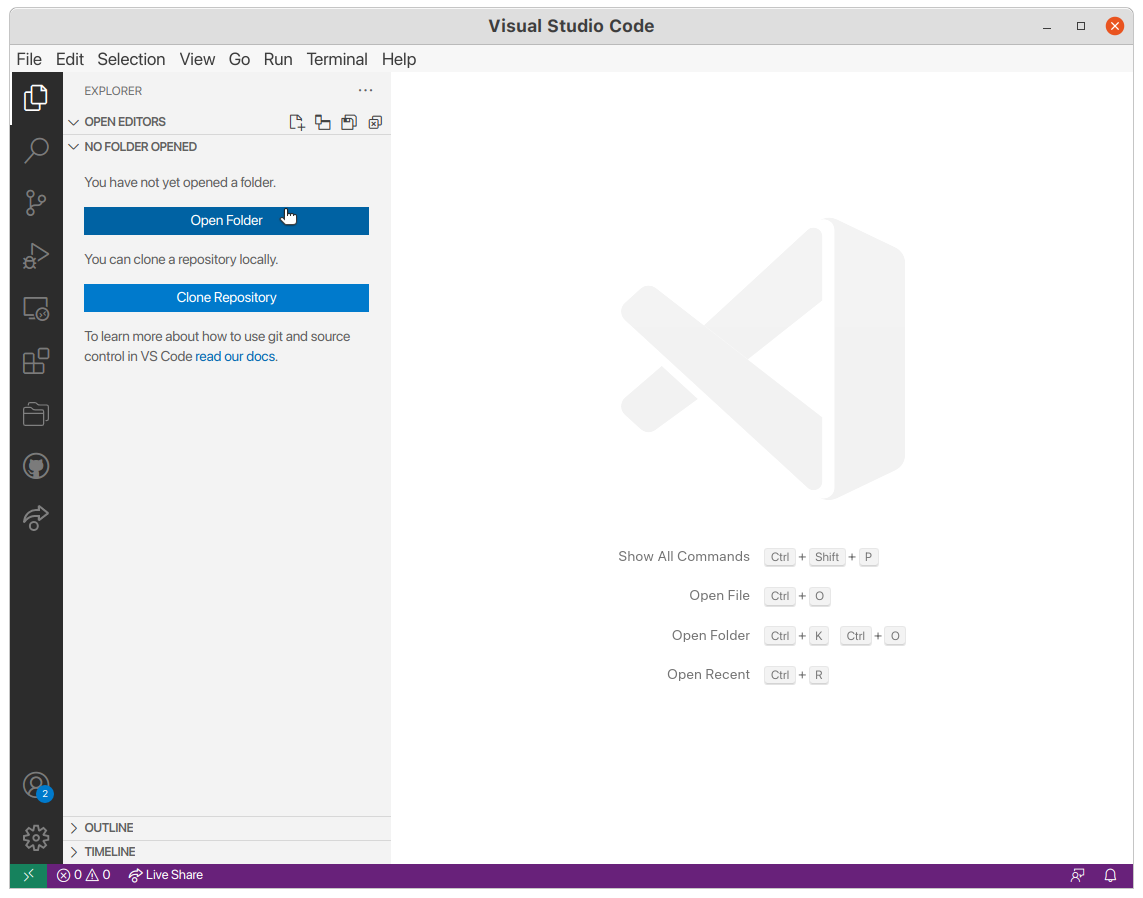
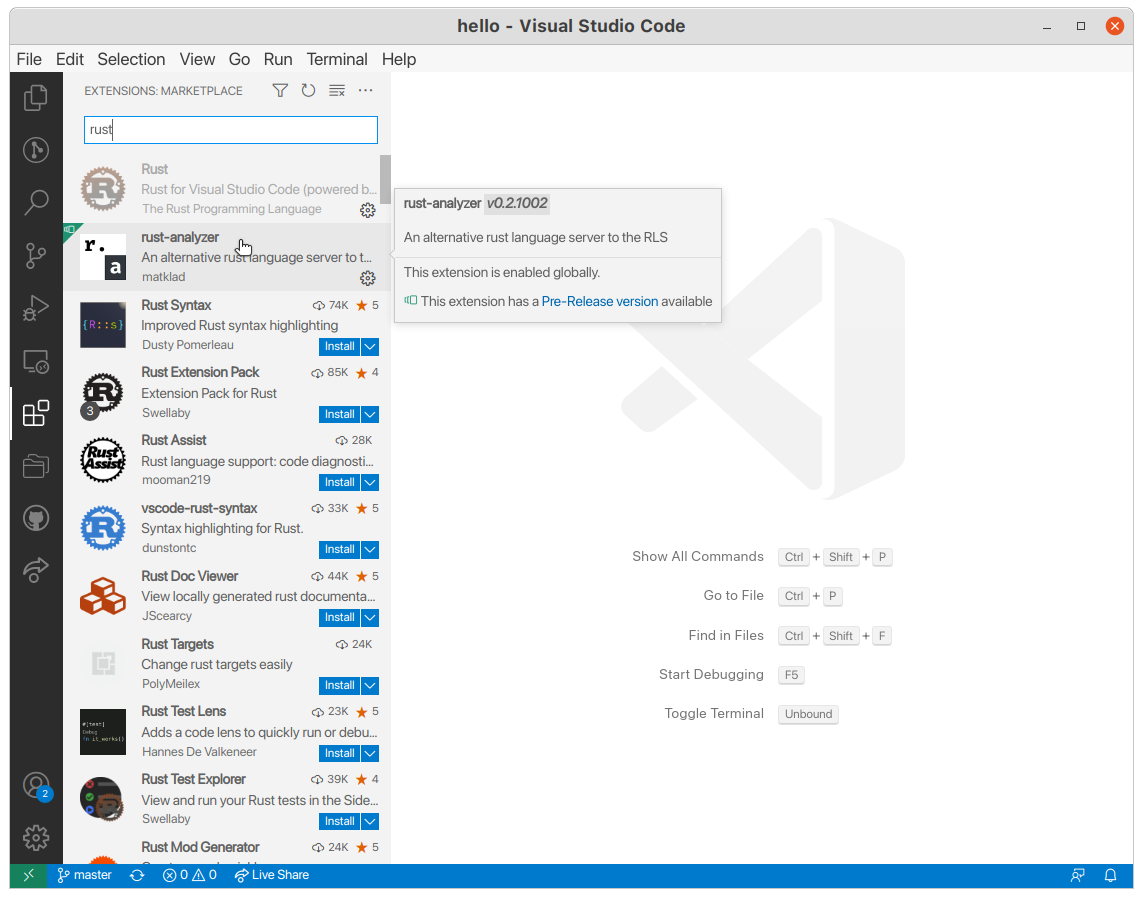
Your project is now opened. We need some extensions to make this happen:
- The first extension is the Rust Language Server. For this we have two choices:
- rust-analyzer (Recommended)
- Rust
- The second extension is the Cortex-Debug extension
These extensions provide features like completion and goto definition, which are very useful features for a modern IDE.
We can now begin to configure VSCode for embedded development.
2. Configure the debugger
Create the .vscode/launch.json file and fill it with this configuration:
{
    "version": "0.2.0",
    "configurations": [
        {
            "type": "cortex-debug",
            "request": "launch",
            "name": "Debug with OpenOCD",
            "servertype": "openocd",
            "cwd": "${workspaceRoot}",
            "runToEntryPoint": "main",
            "executable": "${workspaceFolder}/target/thumbv6m-none-eabi/debug/${workspaceFolderBasename}",
            "configFiles": [
                "interface/stlink-v2-1.cfg",
                "target/stm32f0x.cfg"
            ],
            "gdbPath": "gdb-multiarch",
            "gdbTarget": "thumbv6m-none-eabi",
            "postLaunchCommands": [
                "monitor arm semihosting enable",
            ],
        },
    ]
}
Beware: If your compiled binary file has a different name than your workspace folder name, just replace ${workspaceFolderBasename} by the executable name.
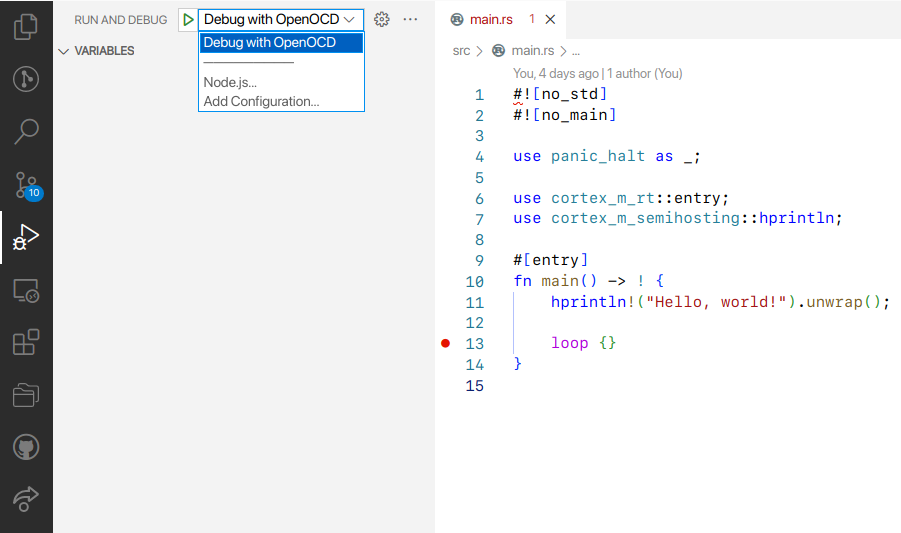
Once this file is created and saved, you should see a new option appear in the Debug tab with the name we gave this configuration: "Debug with OpenOCD".
Before starting the debug, you might notice that the main code lifts an error when analyzed by rust-analyzer. This has to do with the fact that we didn't write any test for our program for now. To make this error go away, we will open our Cargo.toml file and add the following lines:
[[bin]]
name = "hello"
test = false
bench = false
We will also add this line at the end of our .gitignore to avoid uploading the cortex-debug generated files to git:
.vscode/.cortex-debug*
Automatically building the code when we want to debug is also very useful. Create the .vscode/tasks.json file and add a building task:
{
    "version": "2.0.0",
    "tasks": [
        {
            "type": "cargo",
            "command": "build",
            "problemMatcher": [
                "$rustc"
            ],
            "group": "build",
            "label": "build"
        }
    ]
}
We can now link this task by adding the following line in our configuration, in the .vscode/launch.json:
"preLaunchTask": "build",
Here is our new .vscode/launch.json file:
{
    "version": "0.2.0",
    "configurations": [
        {
            "type": "cortex-debug",
            "request": "launch",
            "name": "Debug with OpenOCD",
            "servertype": "openocd",
            "cwd": "${workspaceRoot}",
            "runToEntryPoint": "main",
            "executable": "${workspaceFolder}/target/thumbv6m-none-eabi/debug/${workspaceFolderBasename}",
            "configFiles": [
                "interface/stlink-v2-1.cfg",
                "target/stm32f0x.cfg"
            ],
            "gdbPath": "gdb-multiarch",
            "gdbTarget": "thumbv6m-none-eabi",
            "postLaunchCommands": [
                "monitor arm semihosting enable",
            ],
            "preLaunchTask": "build",
        },
    ]
}
3. Debugging with VSCode
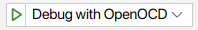
We can now start to debug! Go to the Debug Tab and hit the play button with the "Debug with OpenOCD" profile selected:
The debugger should launch and stop at the #[entry] line:
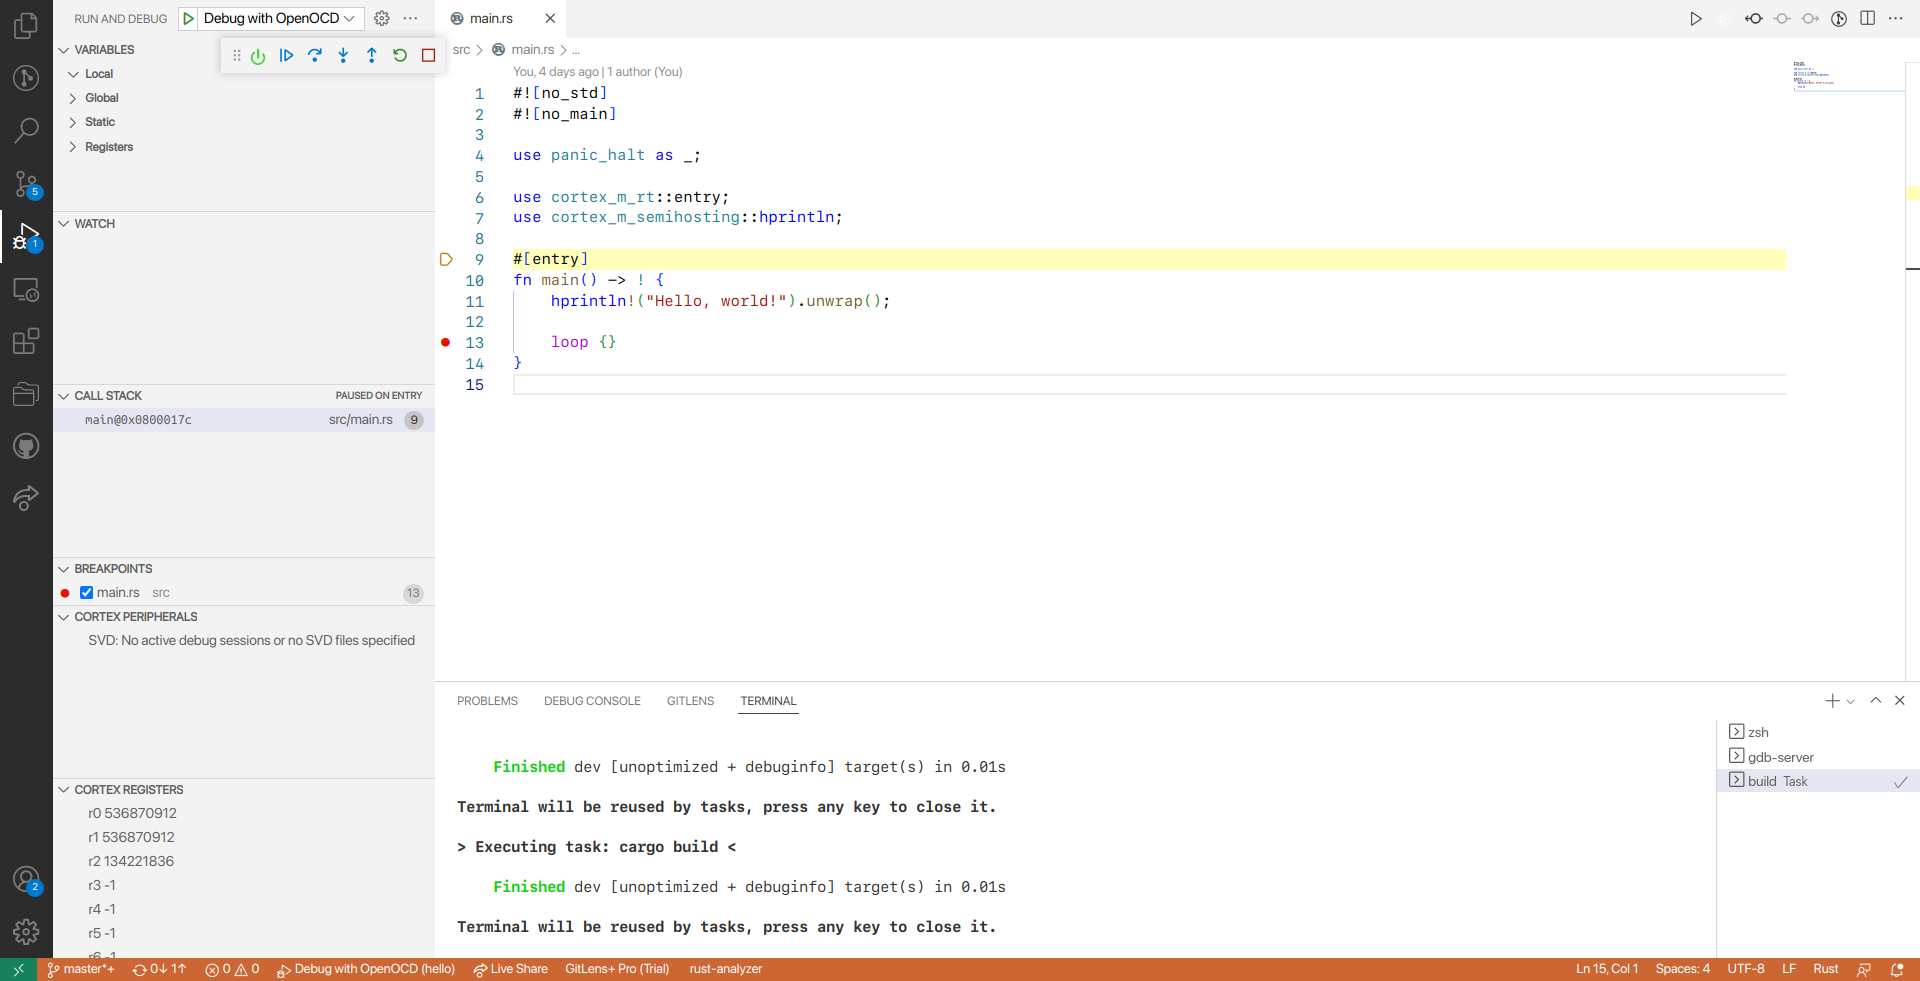
We can see at the bottom of the window (in the Terminal tab), that our code was built successfully before launching the debugger. If we change our terminal to the gdb-server one (by hitting gdb-server in the bottom-right of the screen), we can directly see the OpenOCD console, connected to our board:
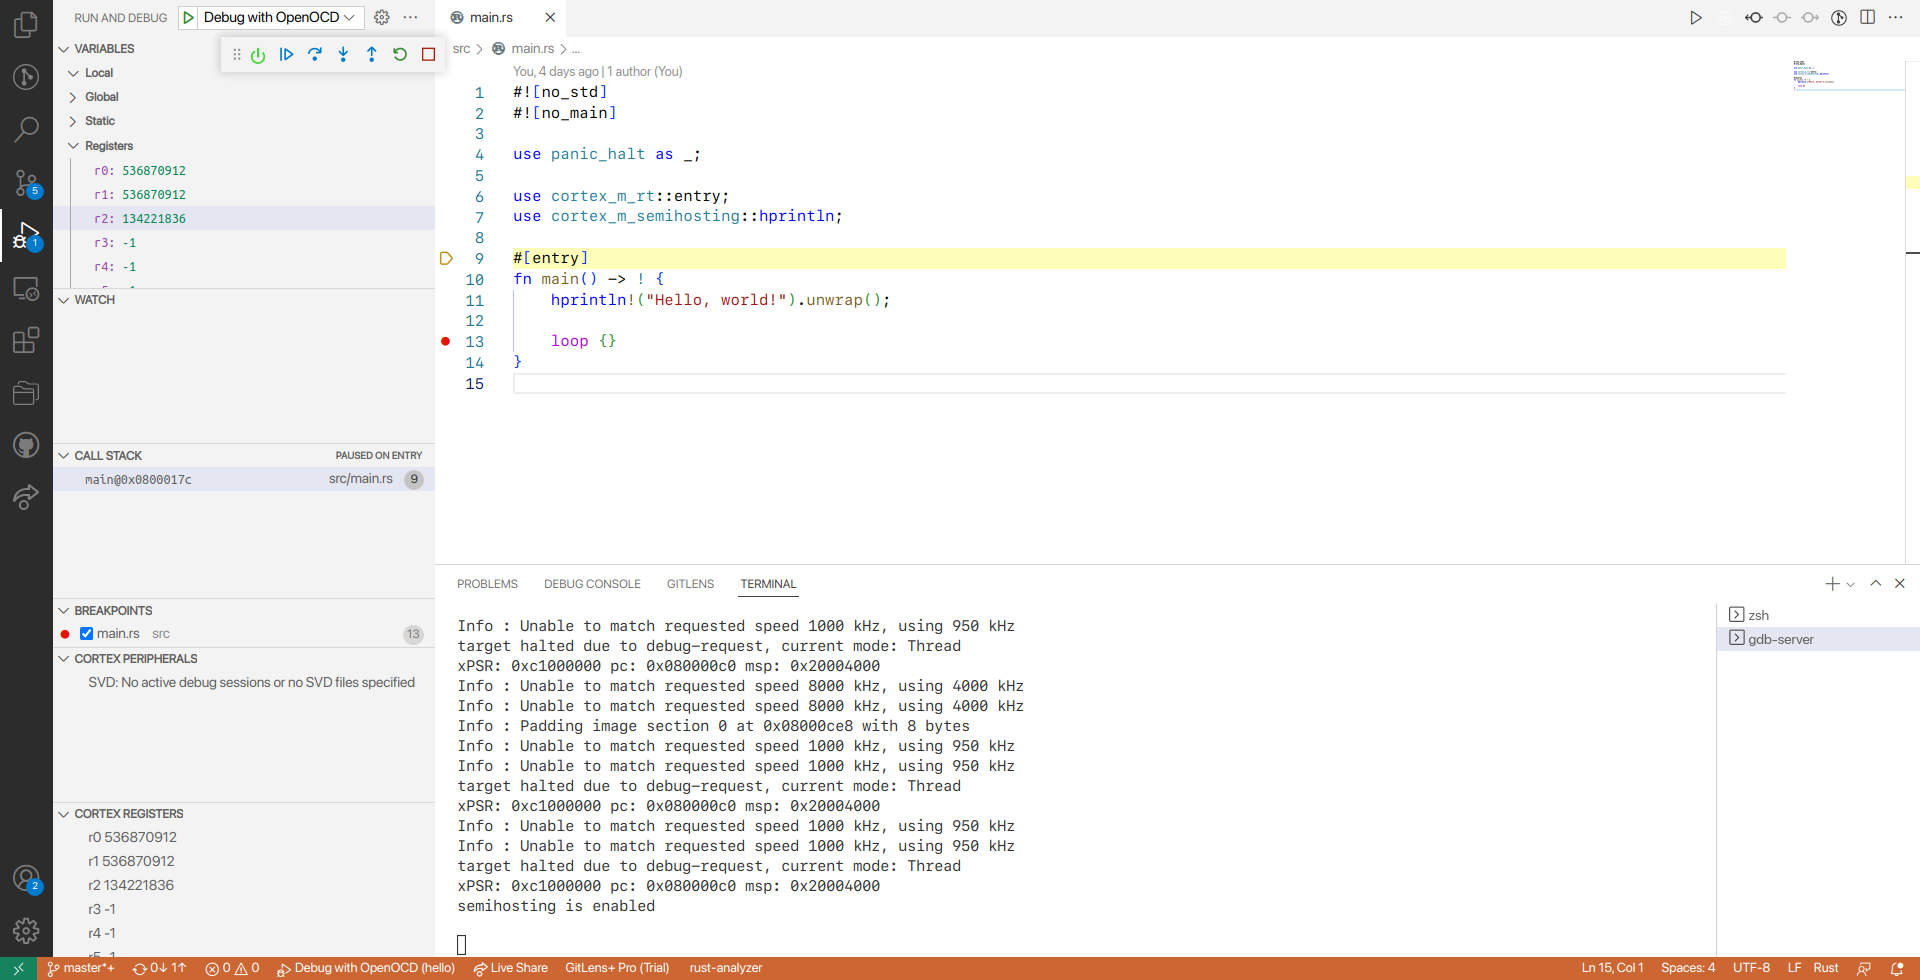
What is unfornate is that, even if we are able to see the general registers values (which can be useful to debug Assembly code), we are not able to see the values of our peripheral registers... Let's change this right away!
For the debugger to know what peripherals are available on your board, it needs to have a description of the hardware of your MCU. This description is provided by the SVD files. SVD files can be downloaded directly from the manufacturer, but I'll spare you the hustle of looking for them for this board: download the SVD File for STM32F0x2.
Once you have downloaded the archive, extract it and move the STM32F0x2.svd file to the .vscode/ folder (so that we know where it is).
Add the following line to the .vscode/launch.json configuration:
"svdFile": ".vscode/STM32F0x2.svd",
Here is our final .vscode/launch.json file:
{
    "version": "0.2.0",
    "configurations": [
        {
            "type": "cortex-debug",
            "request": "launch",
            "name": "Debug with OpenOCD",
            "servertype": "openocd",
            "cwd": "${workspaceRoot}",
            "runToEntryPoint": "main",
            "executable": "${workspaceFolder}/target/thumbv6m-none-eabi/debug/${workspaceFolderBasename}",
            "configFiles": [
                "interface/stlink-v2-1.cfg",
                "target/stm32f0x.cfg"
            ],
            "gdbPath": "gdb-multiarch",
            "gdbTarget": "thumbv6m-none-eabi",
            "postLaunchCommands": [
                "monitor arm semihosting enable",
            ],
            "preLaunchTask": "build",
            "svdFile": ".vscode/STM32F0x2.svd",
        },
    ]
}
Putting the SVD file in your project is better for portability, but it's 32 000 lines of XML code which will be copied in every project... If you want to avoid this, you might want to move it somewhere safe on your computer and update its path in the .vscode/launch.json configuration.
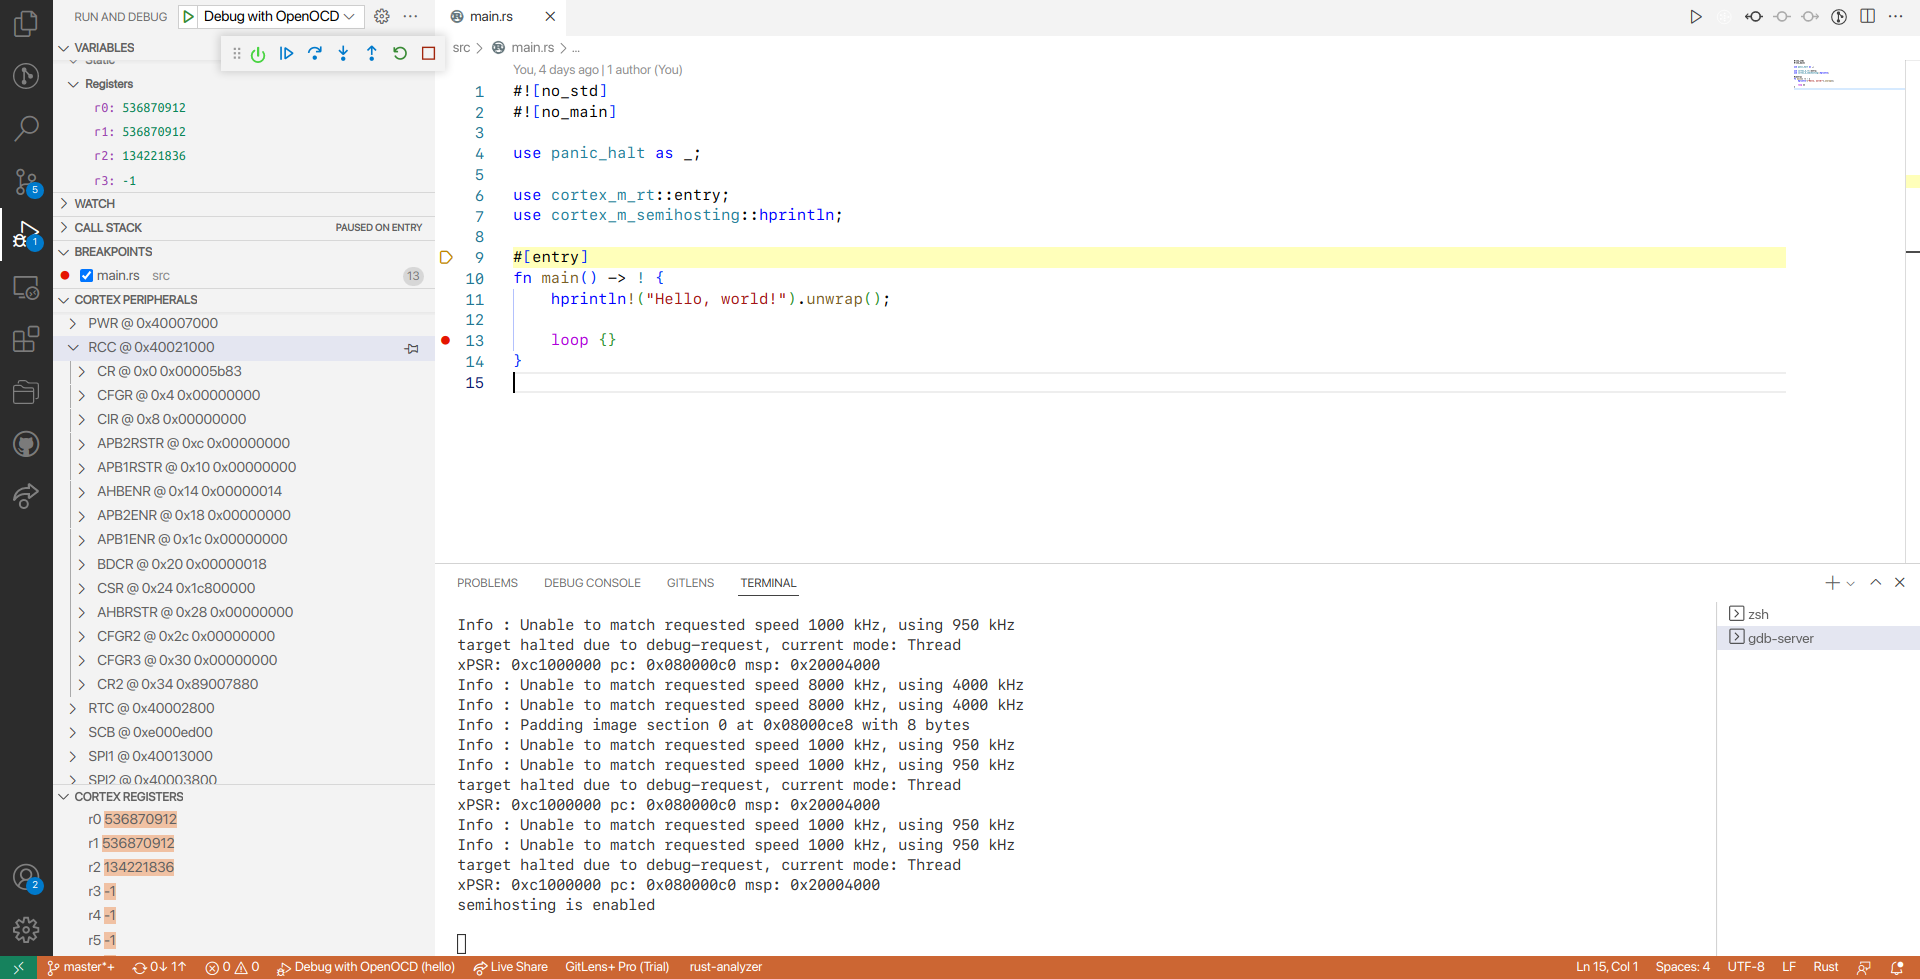
Relaunch the Debugger and admire our peripheral registers appear (on the left of the screen) in all their glory! (you'll learn to love them, don't worry...):
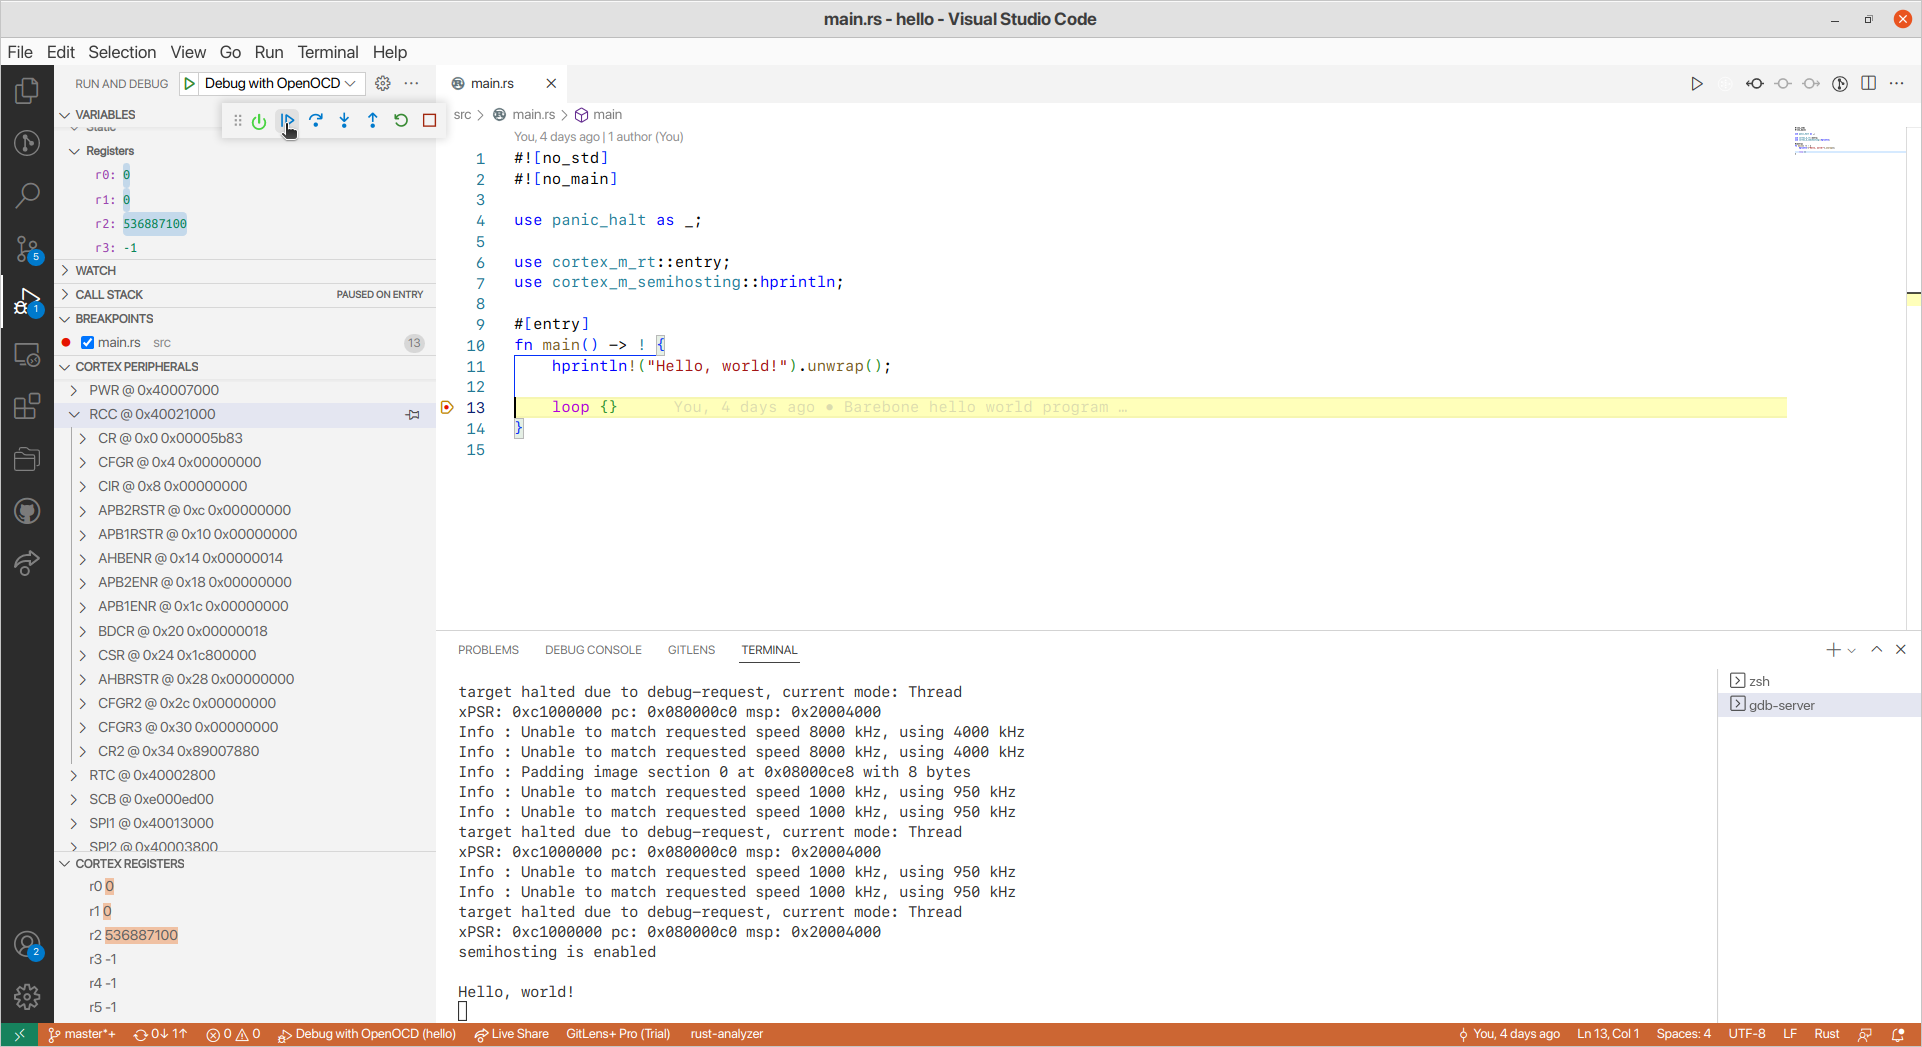
You can now put a breakpoint at the 13 loop{} line in our main.rs file (by clicking on the left of the line numbers) and hit play on the debugger interface () to see our beautiful message appear on the gdb-server terminal!
We finally configured our tools to write code, build and debug Rust for STM32 targets! We now get to do the most fun part: using these tools!