
This Rust version of the tutorial doesn't use the STM32-dedicated Integrated Development Environment (IDE) provided by ST (STM32CubeIDE), unlike OG PoMAD. STM32CubeIDE is not evil, but it is made to code in C language and uses gcc to compile. In this version, we use VSCode, which is a modern code editor widely used by multiple coding community, include the Rust community.
PS: Don't complain, we could have provided this tutorial only for command line programming and debugging :-)...
To complete these tutorials, you'll need to install the following software on your computer :
 VSCode : Integrated Development Environment (IDE) which is not the Eclipse/gcc based IDE officially developed and promoted by ST (this would be STM32CubeIDE). In these tutorials, we use VSCode to show an alternative IDE that can be used. To get tutorials on CubeIDE, check out the original PoMAD website: pomad.fr.
 STM32CubeProgrammer : A standalone software for programming (flashing) STM32 devices. It is also useful to program device Option Bytes (OB) and can also be used to update ST-Link firmware.
 STM32CubeMonitor : A Node-RED based application to monitor live variables and build custom dashboards.
1. VSCode
You can download VSCode from the website: code.visualstudio.com.
I suppose if you're running Ubuntu, you know how to install a .deb package... But just in case:
sudo apt-get install code_X.XX.X-XXXXXXX_amd64.deb
2. STM32CubeProgrammer

You can download the STM32CubeProgrammer from ST website: www.st.com/en/development-tools/stm32cubeprog.html.
If you are using a USB port to connect to the STM32 device, install the libusb1.0 package by typing the following command:
sudo apt-get install libusb-1.0.0-dev
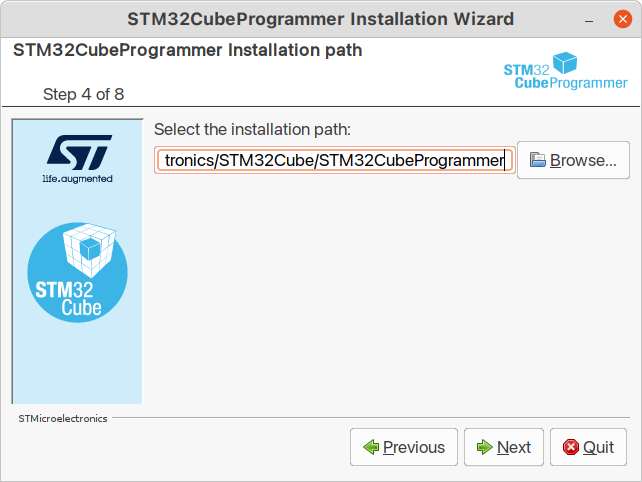
Proceed to the installation by extracting the zip folder and double-clicking the .linux file. You can use the same installation folder as for STM32CubeIDE (if it is installed) (e.g., /home/\<user\>/STMicroelectronics/STM32Cube/STM32CubeProgrammer):
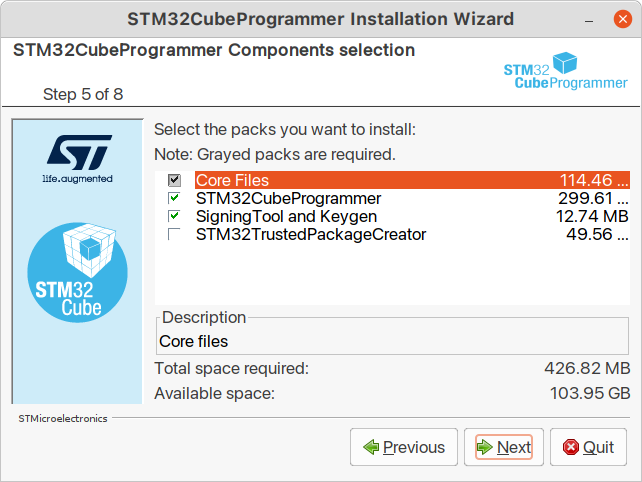
Then accept default options:
When finished, unplug the Nucleo USB cable (if plugged) and launch STM32CubeProgrammer using your OS:
STM32CubeProgrammer should then signal that no ST-Link is found:
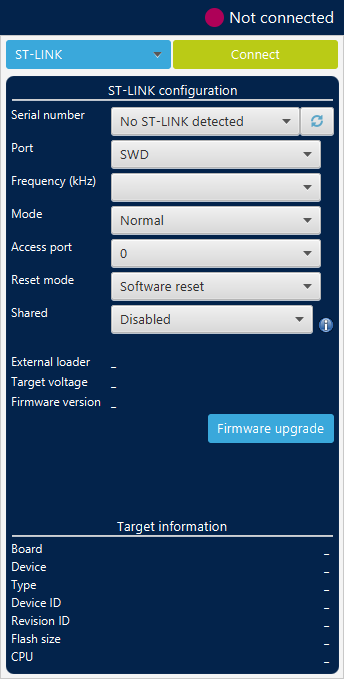
Then, connect the Nucleo USB cable and hit the refresh ![]() button. Now the ST-Link debug probe is found.
button. Now the ST-Link debug probe is found.
Before connecting to the target STM32, let us see if the ST-Link requires a firmware update.
Hit the ![]() button.
button.
In the STLinkUpgrade dialog box, click the Open in update mode button first. ST-Link will be briefly disconnected/reconnected and update information appears in the lower part of the window.
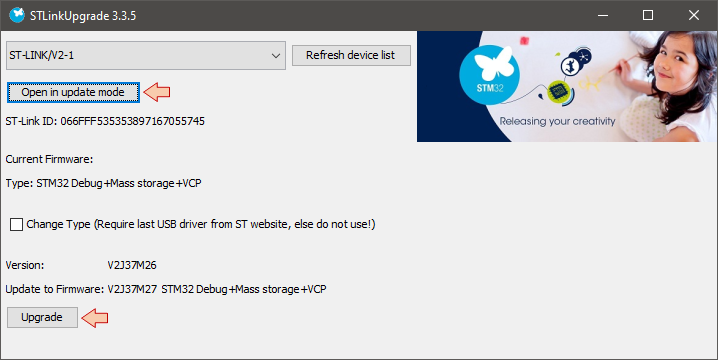
Then click the Upgrade button and wait until the process complete. A message tells you that the process is successful.
Now click the ![]() button.
button.
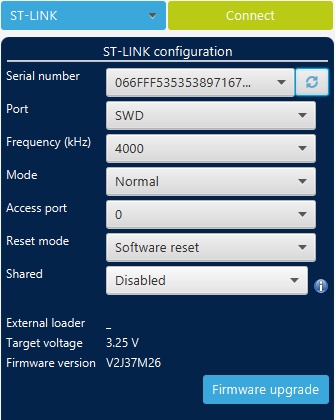
Make sure that the status changed to "Connected":

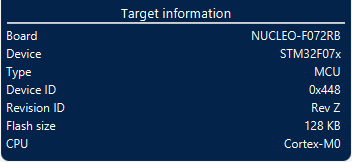
Then review the Target information region. This one should report the found target board and device:
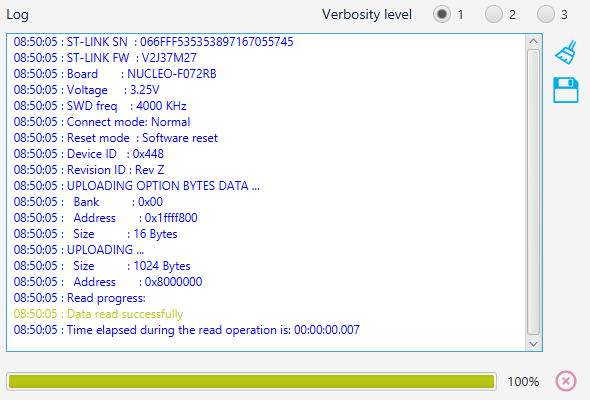
Also review the Log area which reports useful information gathered while connecting to the target:
If everything went as expected, you can now feel confident that all is working properly and that you have an up-to-date ST-Link.
IMPORTANT WARNING : Within STM32CubeProgrammer, you can access Option Bytes (OB) and change the memory Read Out and Write protection level. DO NOT TRY ANYTHING HERE unless instructed. Changing the memory protection level is an irreversible action that will definitely brick your Nucleo board and is intended for mass production and intellectual property protection.
If you memory protect your development board, then you can keep it as a decorative fashion accessory. Yet, too big for earrings...
You've been warned...
Click the Disconnect button, and close STM32CubeProgrammer.

3. STM32CubeMonitor
Last in the list is the STM32CubeMonitor tool.
It is available for download from ST web site : www.st.com/en/development-tools/stm32cubemonitor.html
Launch the installer:
sudo apt-get install <extracted_folder_path>/stm32cubemonitor_X.X.X_amd64.deb
Accept the user agreement (after having read it, of course...).
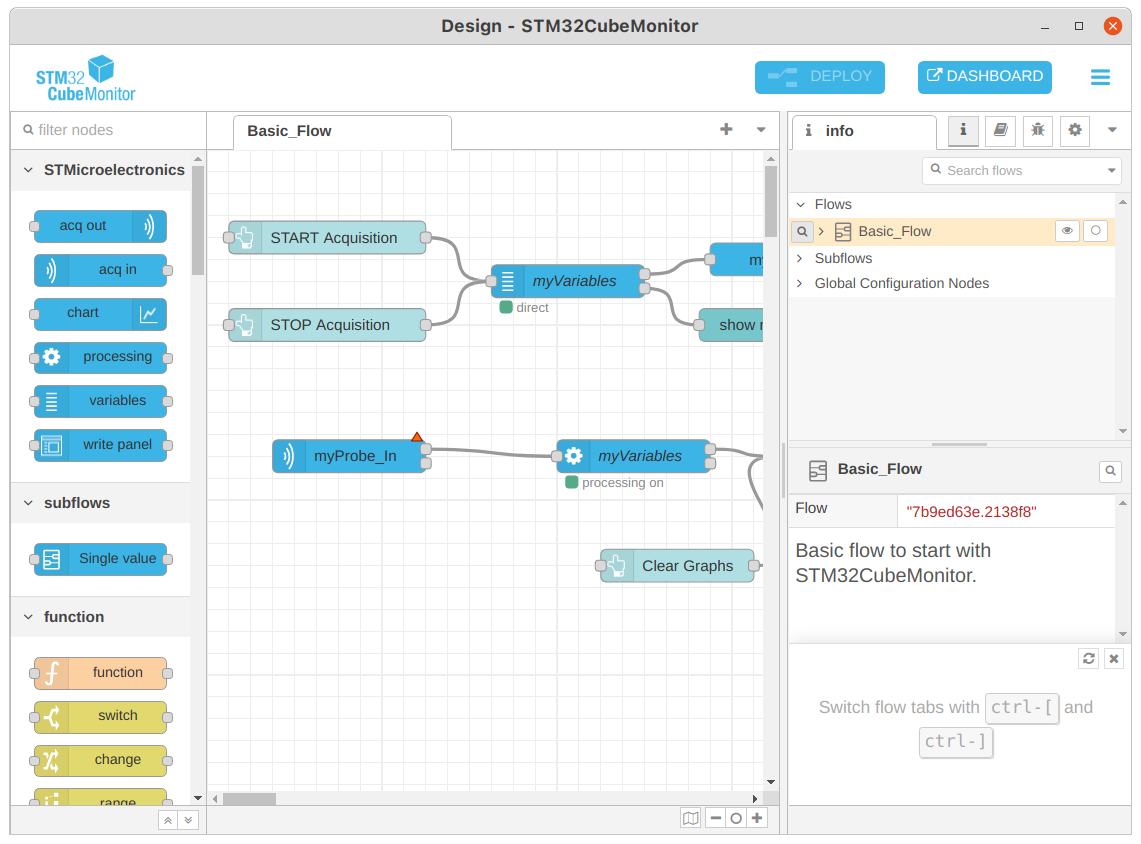
When done, just make sure that STM32CubeMonitor launches without problems:
Then quit the application for now. We'll leave this for another tutorial when required.
4. Summary
In this tutorial, we've setup all the software tools you'll need to proceed with the subsequent STM32 training program. If you've followed above instructions well, you've got 3 development tools at your disposal:
- The Integrated Development Environment (IDE), which is the place you write programs, build executables and perform debugging tasks.
- A standalone programmer tool, useful to check that ST-Link and target board are healthy, and necessary to perform low-level configuration.
- A tool to monitor live variables at runtime and build custom dashboard. You must consider this as another (complementary) debug approach to the standard debugging process. It is particularly useful during optimization of real time control projects and more generally with projects that involve signal processing.