
1. Prepare the project
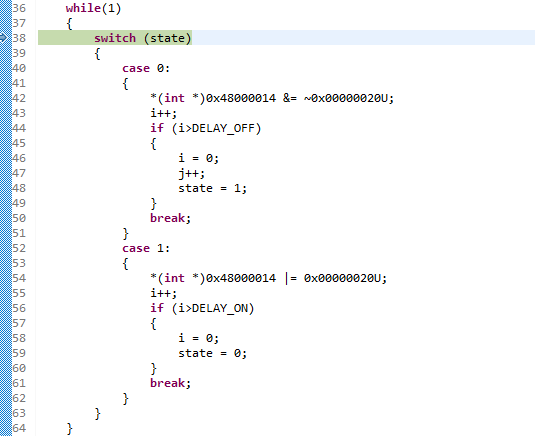
Using the project from previous tutorial (blink2), edit main.c to this other blinking demo:
/*
* main.c
*
* Created on: May 1, 2021
* Author: Laurent
*/
#define DELAY_ON 20000
#define DELAY_OFF 100000
void reset_handler (void);
void default_handler (void);
int main (void);
/* Minimal vector table */
__attribute__ ((section(".isr_vector")))
void (* const interrupt_vector_table[])(void) =
{
(void *)0x20000800, // 0 - stack
reset_handler, // 1 - reset handler
default_handler, // 2 - NMI handler
default_handler, // 3 - Hardfault handler
};
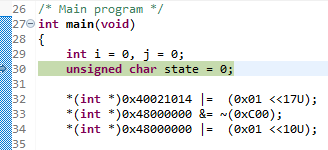
/* Main program */
int main(void)
{
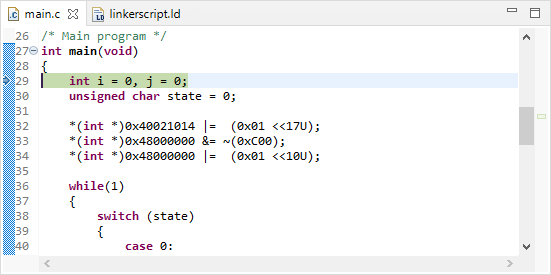
int i = 0, j = 0;
unsigned char state = 0;
*(int *)0x40021014 |= (0x01 <<17U);
*(int *)0x48000000 &= ~(0xC00);
*(int *)0x48000000 |= (0x01 <<10U);
while(1)
{
switch (state)
{
case 0:
{
*(int *)0x48000014 &= ~0x00000020U;
i++;
if (i>DELAY_OFF)
{
i = 0;
j++;
state = 1;
}
break;
}
case 1:
{
*(int *)0x48000014 |= 0x00000020U;
i++;
if (i>DELAY_ON)
{
i = 0;
state = 0;
}
break;
}
}
}
}
/* Reset handler */
void reset_handler (void)
{
main();
}
/* Default handler */
void default_handler(void)
{
while(1);
}
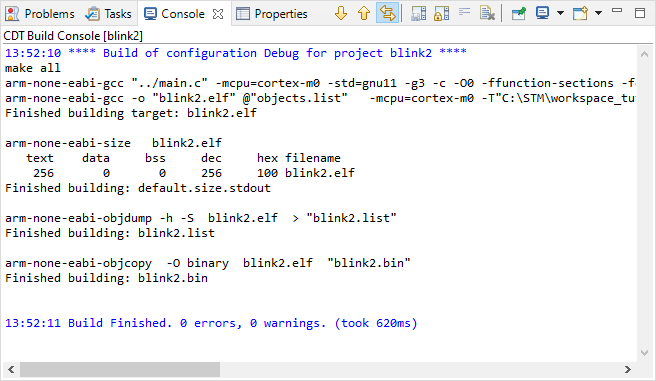
Save all  and build
  the project. There must be no error or warning:
Note that debugging is only possible when the project builds without error. If the project does not compile due to syntax errors for instance, then you must fix these errors before being able to start a debug session. To do that, all the help you have are the messages that the compiler outputs into the console. Therefore, debugger is only involved for tracking errors (bug) into “working” program…
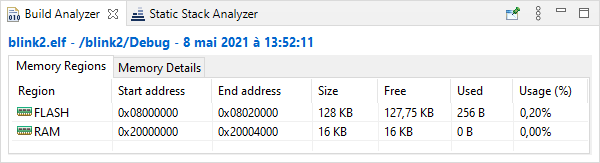
Take a look at the Build Analyzer window. It shows the amount of memory used by the current project. Note that only statically allocated variables are taken into account in the memory usage, therefore local variables such as i, j, or state are nowhere in this report. You can explore the Memory Details tab to verify this.
2. Debug session
Make sure that the Nucleo board is connected to the computer and that you have a valid debug configuration. Then start the debugger ![]() .
.
Give a try hitting the resume button  . You should see the green LED flashing.
Suspend code execution  , and then reset the debugger to the main() entry point
  :
:
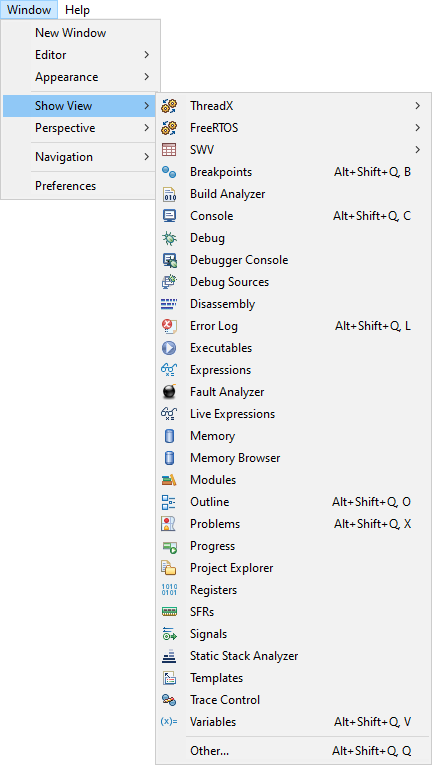
The debugger offers several interesting views of MCU internal state. These views can be opened using the Window →Show View menu:
2.1. Step through disassembly code
Open the  Disassembly view. It should open on the right side of the main editor, pointing the next machine instruction to be executed.
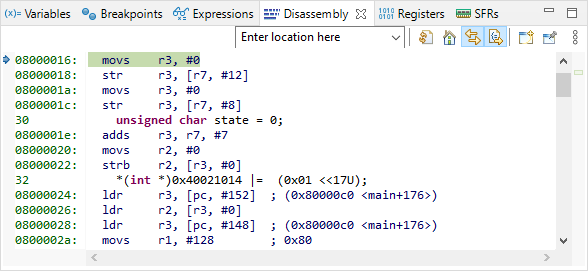
Execute the first line of the C code by pressing the Step-Over button  only once and observe the code pointer (arrow) in both C and disassembly window. The first line of the C program corresponds to 4 assembly code lines, therefore it required 4 machine cycles to execute (actually, 2 cycles for each variable (i, j) initialization).
|
|
|
| C source | Assembly code |
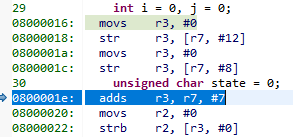
Next 3 assembly lines are supposed to store the value 0 into the memory location corresponding to the variable state. Let us decompose this simple process. To do that, first open the Register view.
Next toggle the Instruction Stepping Mode by clicking the  button in the main toolbar.
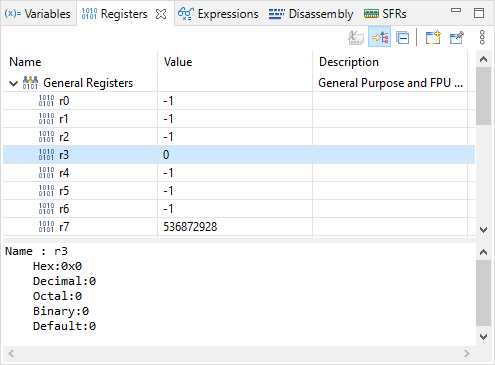
The first assembly line performs adds r3, r7, #7. According to programming manual, this operation takes the content of r7, add the value 7 to this content, and store the result in r3. Open the  Registers view and step over this line.
Is it doing as expected?
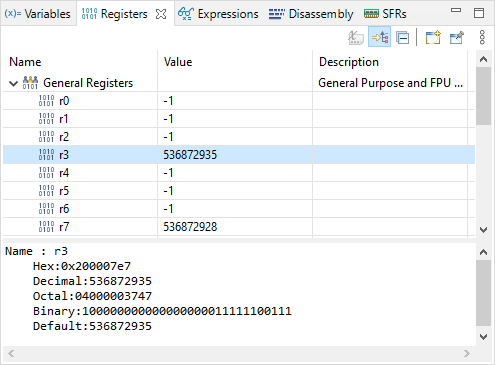
Change the number format of the r3 value into Hex (right-click →Number Format). r3 now holds the value 0x200007e7. This value looks like an address in the user memory. It might be the address of the state variable. Let us check that.
Open the  Expressions view. Click
 ![]() Add new expression and type ‘&state’. The tab now should look like this:
Add new expression and type ‘&state’. The tab now should look like this:
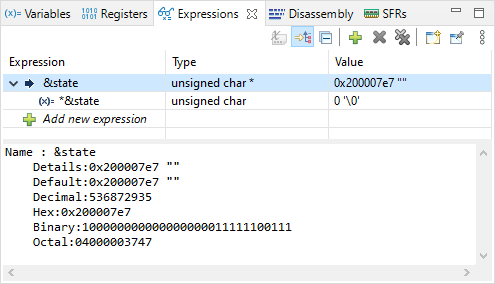
By unfolding &state, you can also see *&state, which is nothing else than the value held by the state variable. The value of &state is the address in memory of the variable state. As expected, it is the same as the content of register r3.
Next assembly line is movs r2, #0. This should reset to 0 the content of r2. Step into the line and observe the Registry view to verify the effect of this line on r2.
Next assembly line is strb r2, [r3, #0]. This instruction stores the content of r2 (i.e. 0) into the memory at address pointed by r3 with an offset 0 (therefore, at the address stored in r3). Note that if state variable is already 0, the line will have no effect.
Then, step-over one assembly line and make sure state is 0.
From now on, let us stop stepping into disassembly code. Press again to deactivate the instruction stepping mode. At this moment, your debugger is stopped on the third line of the C program, just before just before some quite obscure initializations.
Time for having a look into peripheral registers!
2.2. Monitoring peripheral registers
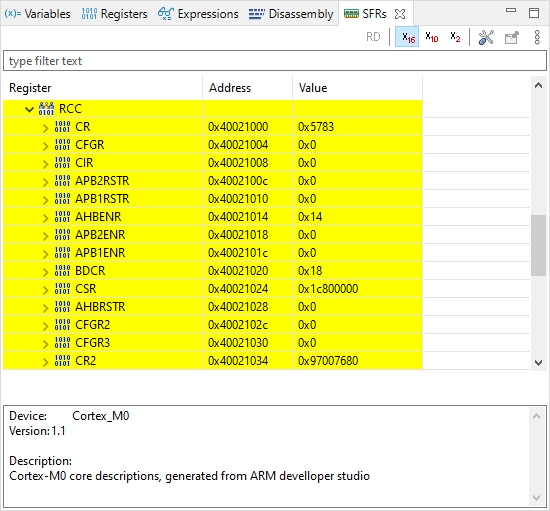
Open the  SFRs view. A new tab will appear with a (long) list of all the MCU peripheral registers. As you can notice, some peripherals belongs to the Cortex-M0 CPU, whereas some others are part of the STM32F0 device.
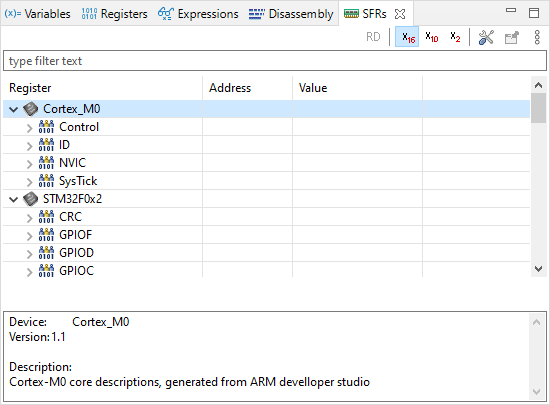
Under the STM32F0x2 category, unfold the RCC peripheral. This provides access to all RCC peripheral registers:
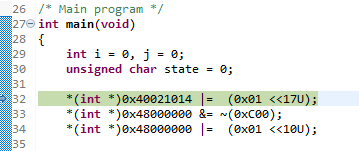
Before stepping over the next code line, let us think about the meaning of it.
*(int *)0x40021014 |= (0x01 <<17U);
- (int*) is a pointer, therefore it is an address in memory
- *(int *) is therefore the value that address holds
- *(int *)0x40021014 is therefore the value held at register address 0x40021014
- |= is a bitwise logical OR between left and right operands
- (0x01 <<17U) corresponds to the value ‘1’ shifted toward the left by 17 bits
The int type represents 32-bit integers :
0x01 = 0x00000001 =
| n | 31 | 30 | 29 | 28 | 27 | 26 | 25 | 24 | 23 | 22 | 21 | 20 | 19 | 18 | 17 | 16 | 15 | 14 | 13 | 12 | 11 | 10 | 9 | 8 | 7 | 6 | 5 | 4 | 3 | 2 | 1 | 0 |
| 0x | 0 | 0 | 0 | 0 | 0 | 0 | 0 | 1 | ||||||||||||||||||||||||
| 0 | 0 | 0 | 0 | 0 | 0 | 0 | 0 | 0 | 0 | 0 | 0 | 0 | 0 | 0 | 0 | 0 | 0 | 0 | 0 | 0 | 0 | 0 | 0 | 0 | 0 | 0 | 0 | 0 | 0 | 0 | 1 | |
(0x01 <<17U) =
| n | 31 | 30 | 29 | 28 | 27 | 26 | 25 | 24 | 23 | 22 | 21 | 20 | 19 | 18 | 17 | 16 | 15 | 14 | 13 | 12 | 11 | 10 | 9 | 8 | 7 | 6 | 5 | 4 | 3 | 2 | 1 | 0 |
| 0x | 0 | 0 | 0 | 2 | 0 | 0 | 0 | 0 | ||||||||||||||||||||||||
| 0 | 0 | 0 | 0 | 0 | 0 | 0 | 0 | 0 | 0 | 0 | 0 | 0 | 0 | 1 | 0 | 0 | 0 | 0 | 0 | 0 | 0 | 0 | 0 | 0 | 0 | 0 | 0 | 0 | 0 | 0 | 0 | |
We don’t know the actual value stored @0x40021014, so let say X can be either 0 or 1 *(int *)0x40021014 =
| n | 31 | 30 | 29 | 28 | 27 | 26 | 25 | 24 | 23 | 22 | 21 | 20 | 19 | 18 | 17 | 16 | 15 | 14 | 13 | 12 | 11 | 10 | 9 | 8 | 7 | 6 | 5 | 4 | 3 | 2 | 1 | 0 |
| 0x | X | X | X | X | X | X | X | X | ||||||||||||||||||||||||
| X | X | X | X | X | X | X | X | X | X | X | X | X | X | X | X | X | X | X | X | X | X | X | X | X | X | X | X | X | X | X | X | |
Given the above, the operation: *(int *)0x40021014 |= (0x01 <<17U) performs the following:
| n | 31 | 30 | 29 | 28 | 27 | 26 | 25 | 24 | 23 | 22 | 21 | 20 | 19 | 18 | 17 | 16 | 15 | 14 | 13 | 12 | 11 | 10 | 9 | 8 | 7 | 6 | 5 | 4 | 3 | 2 | 1 | 0 |
| R= | X | X | X | X | X | X | X | X | X | X | X | X | X | X | X | X | X | X | X | X | X | X | X | X | X | X | X | X | X | X | X | X |
| OR | 0 | 0 | 0 | 0 | 0 | 0 | 0 | 0 | 0 | 0 | 0 | 0 | 0 | 0 | 1 | 0 | 0 | 0 | 0 | 0 | 0 | 0 | 0 | 0 | 0 | 0 | 0 | 0 | 0 | 0 | 0 | 0 |
| R= | X | X | X | X | X | X | X | X | X | X | X | X | X | X | 1 | X | X | X | X | X | X | X | X | X | X | X | X | X | X | X | X | X |
The result being stored at register address 0x40021014
Put in simple words, the operation above does: “set bit number #17 of the register at address 0x40021014 to ‘1’ , and leave other bits as they are”
The value (0x01 <<17U) is called a positive mask in the logical bitwise OR operation.
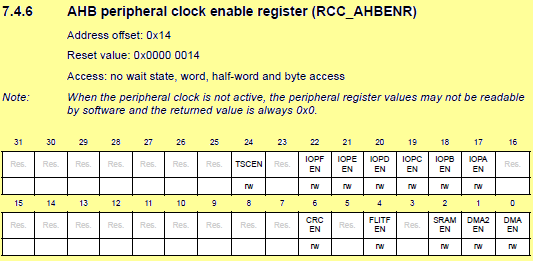
In the SFRs view, unfold the RCC AHBENR register at address 0x40021014. Then step-over once and watch the IOPAEN bit at location 17. It should toggle from 0 to 1. By selecting that particular bit in the SFRs view, you get a short description of what it does.
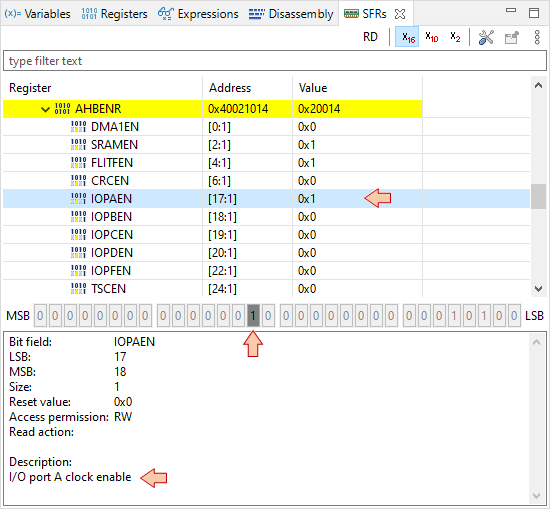
You’ve just turned ON the clock of the General-Purpose Input Output (GPIO) pins associated to the port A (GPIOA). This is done in the Reset and Clock Control (RCC) peripheral.
You can find further information regarding this register in the Reference Manual:
Next two lines concerns register at address 0x48000000:
*(int *)0x48000000 &= ~(0xC00);
*(int *)0x48000000 |= (0x01 <<10U);
0xC00 = 0x00000C00
| n | 31 | 30 | 29 | 28 | 27 | 26 | 25 | 24 | 23 | 22 | 21 | 20 | 19 | 18 | 17 | 16 | 15 | 14 | 13 | 12 | 11 | 10 | 9 | 8 | 7 | 6 | 5 | 4 | 3 | 2 | 1 | 0 |
| 0x | 0 | 0 | 0 | 0 | 0 | C | 0 | 0 | ||||||||||||||||||||||||
| 0 | 0 | 0 | 0 | 0 | 0 | 0 | 0 | 0 | 0 | 0 | 0 | 0 | 0 | 0 | 0 | 0 | 0 | 0 | 0 | 1 | 1 | 0 | 0 | 0 | 0 | 0 | 0 | 0 | 0 | 0 | 0 | |
| ~ | 1 | 1 | 1 | 1 | 1 | 1 | 1 | 1 | 1 | 1 | 1 | 1 | 1 | 1 | 1 | 1 | 1 | 1 | 1 | 1 | 0 | 0 | 1 | 1 | 1 | 1 | 1 | 1 | 1 | 1 | 1 | 1 |
Then
| n | 31 | 30 | 29 | 28 | 27 | 26 | 25 | 24 | 23 | 22 | 21 | 20 | 19 | 18 | 17 | 16 | 15 | 14 | 13 | 12 | 11 | 10 | 9 | 8 | 7 | 6 | 5 | 4 | 3 | 2 | 1 | 0 |
| R= | X | X | X | X | X | X | X | X | X | X | X | X | X | X | X | X | X | X | X | X | X | X | X | X | X | X | X | X | X | X | X | X |
| AND | 1 | 1 | 1 | 1 | 1 | 1 | 1 | 1 | 1 | 1 | 1 | 1 | 1 | 1 | 1 | 1 | 1 | 1 | 1 | 1 | 0 | 0 | 1 | 1 | 1 | 1 | 1 | 1 | 1 | 1 | 1 | 1 |
| R= | X | X | X | X | X | X | X | X | X | X | X | X | X | X | X | X | X | X | X | X | 0 | 0 | X | X | X | X | X | X | X | X | X | X |
| OR | 0 | 0 | 0 | 0 | 0 | 0 | 0 | 0 | 0 | 0 | 0 | 0 | 0 | 0 | 0 | 0 | 0 | 0 | 0 | 0 | 0 | 1 | 0 | 0 | 0 | 0 | 0 | 0 | 0 | 0 | 0 | 0 |
| R= | X | X | X | X | X | X | X | X | X | X | X | X | X | X | X | X | X | X | X | X | 0 | 1 | X | X | X | X | X | X | X | X | X | X |
In simple words, the operation is: “set bits [11 10] of resister at address 0x48000000 to value ‘01’, leaving other bits as they are.”
Because leaving other bits unchanged requires a OR operation which can only set to '1' unmasked bits, we need first to reset all bits under interest to 0. That’s the purpose of the AND operation using ~(0xC00) as a negative mask.
Step-over ![]() the two lines and watch the GPIOA register MODER at address 0x48000000:
the two lines and watch the GPIOA register MODER at address 0x48000000:

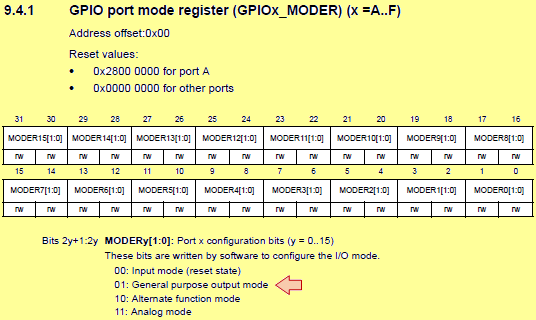
MODER is the register that defines the direction (input/output) of each MCU pins associated with GPIOs. What we’ve just done, is to set PA5 pin as an output.
Note that if the GPIO clock is not started before (as we did), MODER cannot be written. Again, you can refer to Reference Manual to get detailed information regarding the MODER register:
2.3. Monitoring Memory
If everything goes well, the debugger is now stopped at the beginning of the infinite loop:
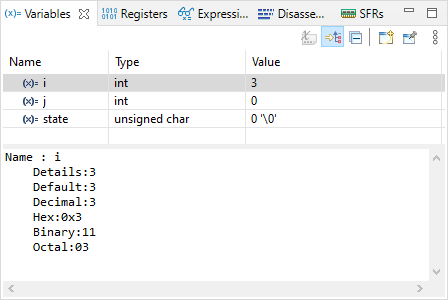
Press ![]() several times to verify that the switch statement behaves as expected (until i=3 for instance). Doing that, observe the values of state, i, j into the
several times to verify that the switch statement behaves as expected (until i=3 for instance). Doing that, observe the values of state, i, j into the  Variables tab.
Open the  Memory view. Add
 ![]() a monitor &i. The memory viewer then shifts to display the location of i variable first (here at address 0x200007ec).
a monitor &i. The memory viewer then shifts to display the location of i variable first (here at address 0x200007ec).
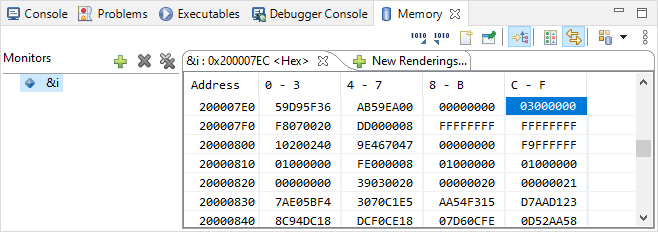
Step over the code another couple of times to see if the value of i correctly changes in both the Variables and Memory views.
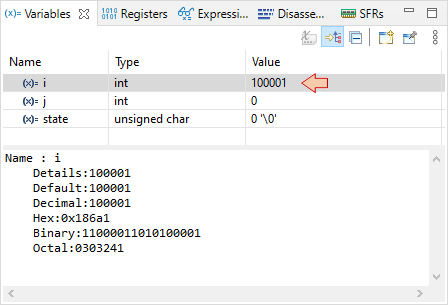
Suppose now that we want to check that the switch statement works well when i variable reaches 100000. Obviously, it would take too much time (and pain) to manually step through the code until then.
There are at least 3 ways to achieve this much faster:
- Change the value of i to something close to 100000 (eg 99999), in the Variables view
- Position editing cursor on line 46 (first instruction when i>100000) and then use Run→Run To Line
 menu command
 - Set a breakpoint at line 42, and then press the run button
Let-us try the second method. Position editing cursor on line 46 and then use Run→Run To Line menu command. Watch the value of i in the Variables view. Should be 100001 now.
Step-over the code another couple of times, looking at i, j and state variables and make sure things are behaving as expected (now looping through the state 1).
Press the run button and verify that the LED is blinking in real time, as a normal code execution.
Note that both ![]() Expressions and
Expressions and ![]() Variables views display variables. So why having both?
Variables views display variables. So why having both?
- The Variables view automatically displays variables that are local to the function beeing debugged at a given time. It is not able to display global variables.
- The Expressions view is where you can display global variables and expressions based on variables.
2.4. Using Breakpoints
Suspend the debugger
The code line pointer is somewhere in the main loop, depending on when you pressed the pause button. Let us assume that we want to stop the code execution each time there is a change in the LED state. We can do that with breakpoints.
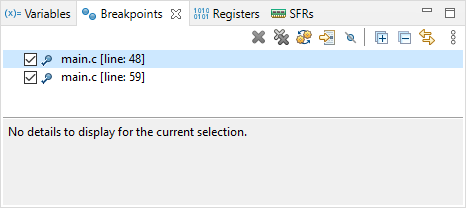
Double-click in the vertical blue lane (on the left of the main editor frame) at line 48 and line 59. You have set two breakpoints, right before LED state changes:
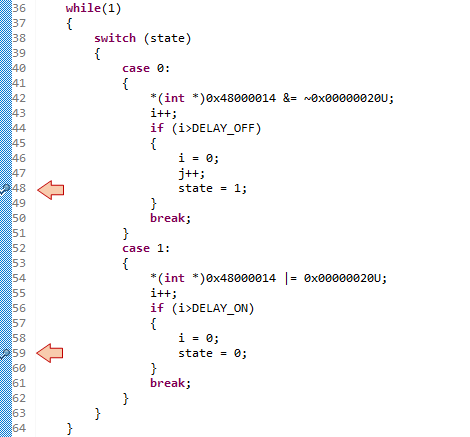
Now the LED state should toggle every time you press , alternatively stopping program execution on either breakpoints. Note that breakpoints are a limited hardware feature of the MCU. STM32F072 offers up to 4 breakpoints. You cannot set as many breakpoints you want.
Info : stm32f0x.cpu: hardware has 4 breakpoints, 2 watchpoints
You can view and manage active breakpoints using the Breakpoints view :
Terminate the debug session  .
.
3. Summary
This tutorial is an overview of most useful features of the debugger. Debugging is an essential process that you should get familiar with. No new code (even apparently working) should be released without a deep check (line by line) under debugger. You’ll be surprised.
Add new comment