
1.3. Running the debugger (2026)
1. Prepare the project
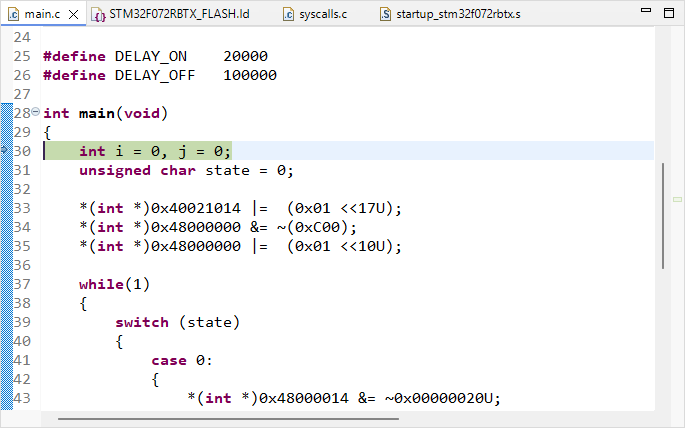
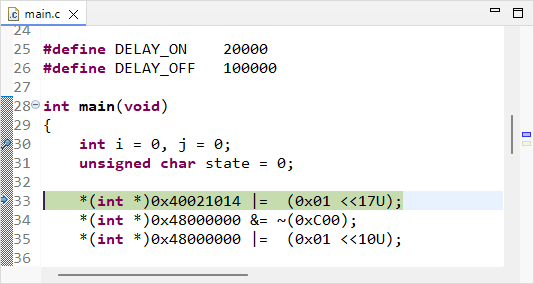
Open the blink project from previous tutorial and change the content of main() function to this:
#define DELAY_ON	20000
#define DELAY_OFF	100000

int main(void)
{
    int i = 0, j = 0;
    unsigned char state = 0;

	*(int *)0x40021014 |=  (0x01 <<17U);
	*(int *)0x48000000 &= ~(0xC00);
	*(int *)0x48000000 |=  (0x01 <<10U);

	while(1)
	{
		switch (state)
		{
			case 0:
			{
				*(int *)0x48000014 &= ~0x00000020U;
				i++;
				if (i>DELAY_OFF)
				{
					i = 0;
					j++;
					state = 1;
				}
				break;
			}
			case 1:
			{
				*(int *)0x48000014 |= 0x00000020U;
				i++;
				if (i>DELAY_ON)
				{
					i = 0;
					state = 0;
				}
				break;
			}
		}
	}
}
Save all ![]() and build
and build ![]() the project. There must be no error or warning:
the project. There must be no error or warning:
arm-none-eabi-size  blink.elf
arm-none-eabi-objdump -h -S blink.elf  > "blink.list"
   text	   data	    bss	    dec	    hex	filename
    648	      0	   1568	   2216	    8a8	blink.elf
Finished building: default.size.stdout

Finished building: blink.list

18:42:04 Build Finished. 0 errors, 0 warnings. (took 391ms)
2. A word on the build report
Before we dive into the debug, let us stop by the information we already have from the build process.
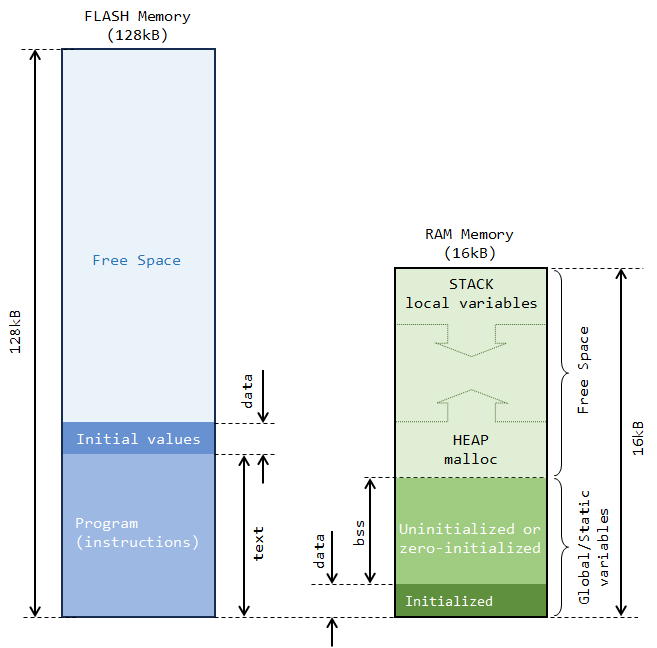
The build report provides data regarding the memory usage of the project:
   text	   data	    bss	    dec	    hex	filename
    648	      0	   1568	   2216	    8a8	blink.elf
These numbers relate to two different physical memories:
The FLASH memory (where the program is stored, non-volatile)
The RAM memory (where the variables live during code execution, volatile)
Basically:
text reports the size of the program to be stored into the FLASH memory (in bytes).
data reports the amount (in bytes) of "non-zero-initialized global or static variables".
When we declare, as global (or static):int id=5;4 bytes are allocated into the RAM to hold the id variable.
Another 4 bytes are allocated into the FLASH to store the number 5.
The startup code is in charge of transferring the number 5 into the variable id before you enter the main() function.
bss reports the amount (in bytes) of "zero-initialized or uninitialized global or static variables.
When we declare as global (or static):int id1; int id2=0;- 4 bytes are allocated into RAM for each id1 and id2 variables.
The startup code initialize id1 and id2 to zero. There is no need to store anything else.
- 4 bytes are allocated into RAM for each id1 and id2 variables.
- dec and hex are the sum (text + data + bss) in decimal and hexadecimal representations, respectively.
The drawing below illustrates the numbers provided by the build report:
In summary, regarding RAM usage, the build only reports what is statically allocated. It is important to note that, most of the time, a large part of the RAM that a project actually needs comes from variables that are local to the (many) functions the program calls (including main()). Those variables are nowhere in the build report, for the reason that it is impossible to predict what will be actually needed before... well execution. In our case, i, j, and state variables are not part of the build report.
Then a question arises...
Why is there about 1.5kB of bss reported here? We have nothing declared as static or global!
Let us first remember how a program works with memory. On one hand, variables local to a function are dynamically created when the function is called, and destroyed when the function returns. The RAM region where this process occurs is called the Stack. On the other hand, dynamic allocation within the program (malloc) takes place in another region of RAM called the Heap. Heap and Stack grow and shrink at the both ends of RAM free space. The free space is simply all the RAM that remains available, after static allocation has been done (see above picture).
Well, these 1.5kB neither represent any variable nor any memory allocation. It is actually free space. It comes from the LinkerScript that is designed to prevent project from compiling if at least 1.5kB of free RAM is not left for the Heap and Stack to work correctly.
_Min_Heap_Size  = 0x200; 	/* required minimal amount of heap  = 512 bytes */
_Min_Stack_Size = 0x400; 	/* required minimal amount of stack = 1024 bytes */
Put in other words, we're only allowed to use 14.5kB of RAM (over the physically 16kB available) for global or static variables. And if we know what we do, there's always the option to remove that security by editing the LinkerScript.
You can also take a look at the Build Analyzer window. You might need to refresh this view using the refresh ![]() button while selecting the blink
button while selecting the blink ![]() project in the Project Explorer.
project in the Project Explorer.
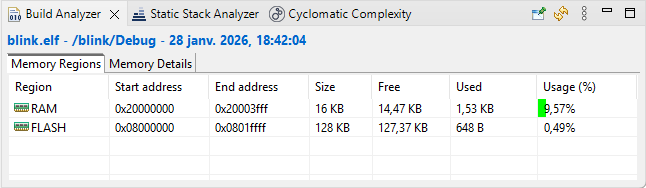
It also shows the amount of memory used by the current project, according to the build report (that is the same information).
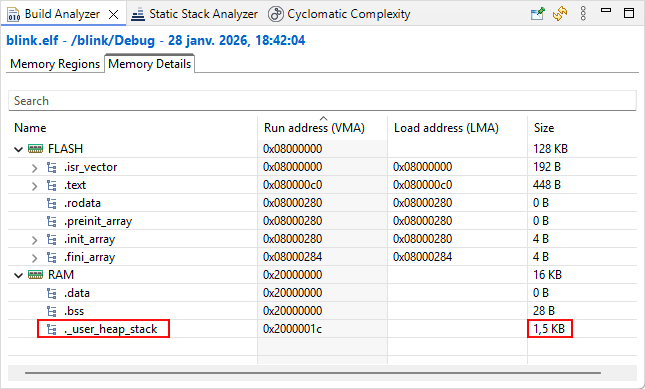
More detailed information is provided in the Memory Details tab. The 1.5kB ._user_heap_stack corresponds to that minimal RAM free space any project must allow, as discussed.
2. Debug session
Make sure that the Nucleo board is connected to the computer and that you have a valid debug configuration. Then start the debugger ![]() .
.
Give a try hitting the resume button ![]() . You should see the green LED flashing.
. You should see the green LED flashing.
Suspend code execution ![]() , and then reset the debugger to the main() entry point
, and then reset the debugger to the main() entry point ![]() :
:
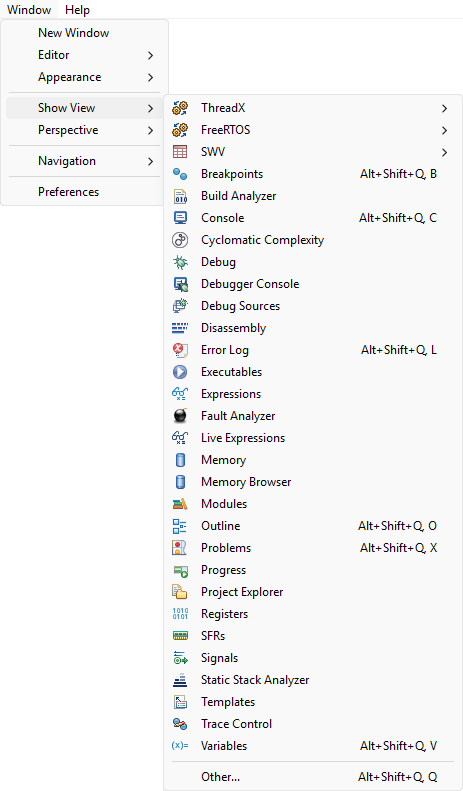
The debugger offers several views of MCU internal state. These views can be opened using the Window →Show View menu:
2.1. Step through disassembly code
One line of C source code usually corresponds to a few lines of assembly code (lower level of CPU instructions). During a debug session, you can step over code lines using the ![]() button. You can toggle whether you want to step over a single C code line or over a single assembly code line using the instruction stepping
button. You can toggle whether you want to step over a single C code line or over a single assembly code line using the instruction stepping ![]() button.
button.
Open the ![]() Disassembly view. It should open on the right side of the main editor, pointing the next machine instruction to be executed.
Disassembly view. It should open on the right side of the main editor, pointing the next machine instruction to be executed.
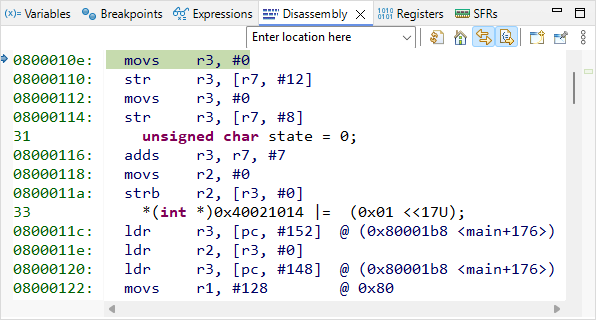
With the instruction stepping mode ![]() being disarmed (off), execute the first line of the C code by pressing the Step-Over button
being disarmed (off), execute the first line of the C code by pressing the Step-Over button ![]() only once and observe the code pointer (arrow) in both C and disassembly window. The first line of the C program corresponds to 4 assembly code lines, therefore it required 4 machine cycles to execute (actually, 2 cycles for each variable (i, j) initialization).
only once and observe the code pointer (arrow) in both C and disassembly window. The first line of the C program corresponds to 4 assembly code lines, therefore it required 4 machine cycles to execute (actually, 2 cycles for each variable (i, j) initialization).
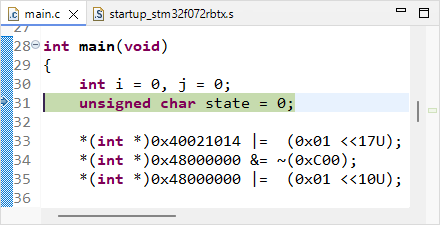 |  |
| C source | Assembly code |
Next 3 assembly lines are supposed to store the value 0 into the memory location corresponding to the variable state. Let us decompose this simple process. To do that, first open the Register view, and display values in Hex format (using the Right-Click contextual menu).
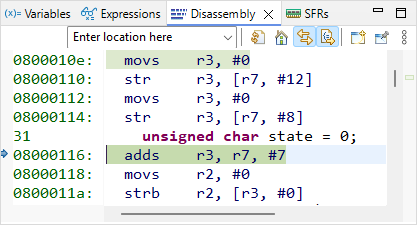
Next toggle the Instruction Stepping Mode by clicking the ![]() button in the main toolbar.
button in the main toolbar.
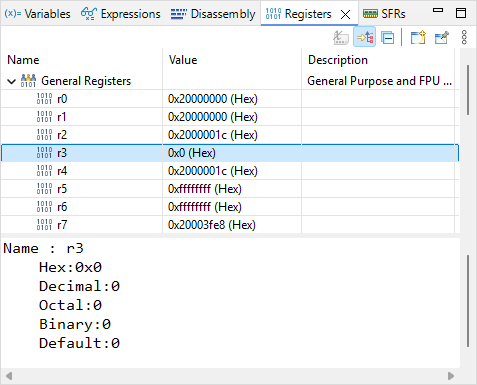
The first assembly line performs adds r3, r7, #7. According to programming manual, this operation takes the content of r7, add the value 7 to this content, and store the result in r3. Open the ![]() Registers view and step over
Registers view and step over ![]() this line.
this line.
Is it doing as expected?
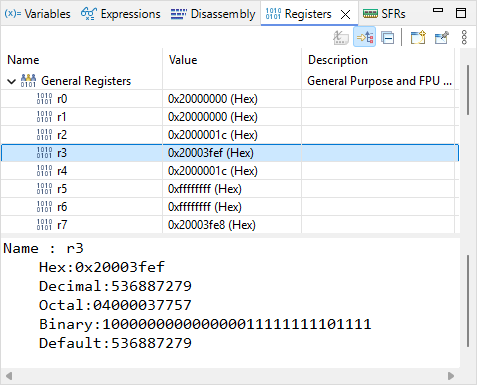
r3 now holds the value 0x20003FEF. This value looks like an address in RAM. It might be the address of the state variable. Let us check that.
Open the ![]() Expressions view. Click
Expressions view. Click ![]() Add new expression and type ‘&state’. The tab now should look like this:
Add new expression and type ‘&state’. The tab now should look like this:
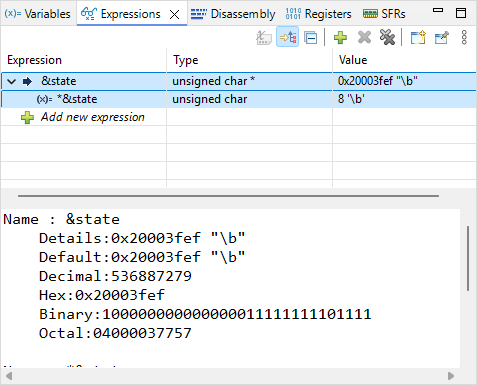
By unfolding &state, you can also see *&state, which is nothing else than the value held by the state variable. The value of &state is the address in memory of the variable state. As expected, it is the same as the content of register r3.
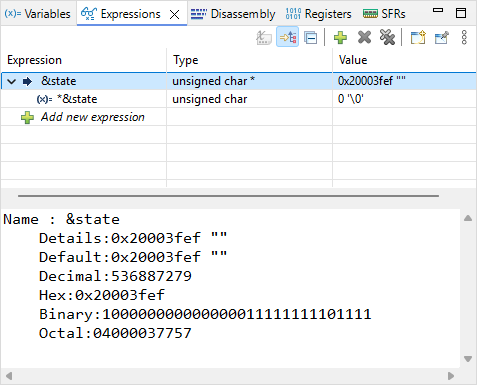
Next assembly line is movs r2, #0. This should reset to 0 the content of r2. Step into the line and observe the Registers view to verify the effect of this line on r2.
Next assembly line is strb r2, [r3, #0]. This instruction stores the content of r2 (i.e. 0) into the memory at address pointed by r3 with an offset 0 (therefore, at the address stored in r3). Note that if state variable is already 0, the line will have no effect.
Then, step-over ![]() one assembly line and make sure state is 0.
one assembly line and make sure state is 0.
For now on, let us stop stepping into disassembly code. Press ![]() again to deactivate the instruction stepping mode. At this moment, your debugger is stopped on the third line of the C program, just before just before some quite obscure initialization.
again to deactivate the instruction stepping mode. At this moment, your debugger is stopped on the third line of the C program, just before just before some quite obscure initialization.
Time for having a look into peripheral registers, and try demystifying this code!
2.2. Monitoring peripheral registers
Open the ![]() SFRs view:
SFRs view:
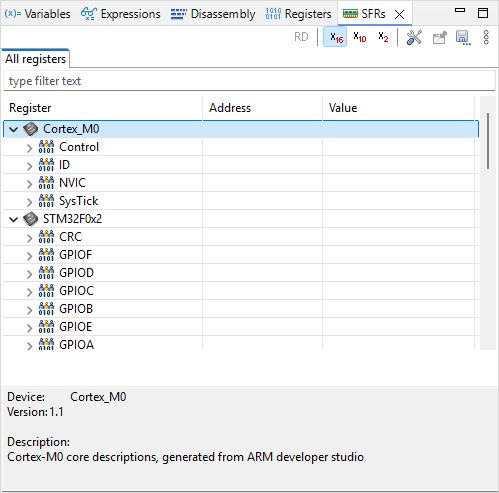
The items listed underneath Cortex_M0 and STM32F0x2 categories are Peripherals. A peripheral is a physical electronic circuit that is designed to accomplish a dedicated task, apart from the CPU code execution. As you can notice, some peripherals belongs to the Cortex-M0 (CPU, designed by ARM®), whereas some others are part of the STM32F0 device (designed by ST®).
Peripherals are configurable circuits. The configuration of a peripheral is done through its Registers.
Under the STM32F0x2 category, unfold the RCC peripheral. This provides access to all RCC registers:
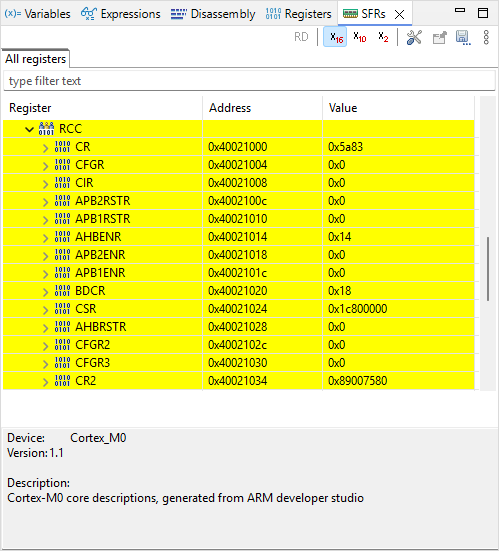
Within a C program, a register is similar to a simple variable which can be read and written. Physically, the memory cells that hold these registers are not located in the RAM, but within the peripheral circuit itself as a bank of flip-flops. That's the main difference. In the STM32, most registers are 32-bit wide (in rare occasions 16-bits or 8-bits), hence manipulated just as any unsigned integer variable.
Before stepping over the next code line, let us think about the meaning of it.
*(int *)0x40021014 |= (0x01 <<17U);(int*) is a pointer, therefore 0x40021014 is an address in memory
*(int *) is then the value that address holds
*(int *)0x40021014 is therefore the value held at register address 0x40021014
|= is a bit-wise logical OR between left and right operands
(0x01 <<17U) corresponds to the value ‘1’ shifted toward the left by 17 bits
The int type represents 32-bit integers :
0x01 = 0x00000001 =
| n | 31 | 30 | 29 | 28 | 27 | 26 | 25 | 24 | 23 | 22 | 21 | 20 | 19 | 18 | 17 | 16 | 15 | 14 | 13 | 12 | 11 | 10 | 9 | 8 | 7 | 6 | 5 | 4 | 3 | 2 | 1 | 0 |
| 0x | 0 | 0 | 0 | 0 | 0 | 0 | 0 | 1 | ||||||||||||||||||||||||
| 0 | 0 | 0 | 0 | 0 | 0 | 0 | 0 | 0 | 0 | 0 | 0 | 0 | 0 | 0 | 0 | 0 | 0 | 0 | 0 | 0 | 0 | 0 | 0 | 0 | 0 | 0 | 0 | 0 | 0 | 0 | 1 | |
(0x01 <<17U) =
| n | 31 | 30 | 29 | 28 | 27 | 26 | 25 | 24 | 23 | 22 | 21 | 20 | 19 | 18 | 17 | 16 | 15 | 14 | 13 | 12 | 11 | 10 | 9 | 8 | 7 | 6 | 5 | 4 | 3 | 2 | 1 | 0 |
| 0x | 0 | 0 | 0 | 2 | 0 | 0 | 0 | 0 | ||||||||||||||||||||||||
| 0 | 0 | 0 | 0 | 0 | 0 | 0 | 0 | 0 | 0 | 0 | 0 | 0 | 0 | 1 | 0 | 0 | 0 | 0 | 0 | 0 | 0 | 0 | 0 | 0 | 0 | 0 | 0 | 0 | 0 | 0 | 0 | |
We don’t know the actual value stored @0x40021014, so let say X can be either 0 or 1 *(int *)0x40021014 =
| n | 31 | 30 | 29 | 28 | 27 | 26 | 25 | 24 | 23 | 22 | 21 | 20 | 19 | 18 | 17 | 16 | 15 | 14 | 13 | 12 | 11 | 10 | 9 | 8 | 7 | 6 | 5 | 4 | 3 | 2 | 1 | 0 |
| 0x | X | X | X | X | X | X | X | X | ||||||||||||||||||||||||
| X | X | X | X | X | X | X | X | X | X | X | X | X | X | X | X | X | X | X | X | X | X | X | X | X | X | X | X | X | X | X | X | |
Given the above, the operation: *(int *)0x40021014 |= (0x01 <<17U) performs the following:
| n | 31 | 30 | 29 | 28 | 27 | 26 | 25 | 24 | 23 | 22 | 21 | 20 | 19 | 18 | 17 | 16 | 15 | 14 | 13 | 12 | 11 | 10 | 9 | 8 | 7 | 6 | 5 | 4 | 3 | 2 | 1 | 0 |
| R= | X | X | X | X | X | X | X | X | X | X | X | X | X | X | X | X | X | X | X | X | X | X | X | X | X | X | X | X | X | X | X | X |
| OR | 0 | 0 | 0 | 0 | 0 | 0 | 0 | 0 | 0 | 0 | 0 | 0 | 0 | 0 | 1 | 0 | 0 | 0 | 0 | 0 | 0 | 0 | 0 | 0 | 0 | 0 | 0 | 0 | 0 | 0 | 0 | 0 |
| R= | X | X | X | X | X | X | X | X | X | X | X | X | X | X | 1 | X | X | X | X | X | X | X | X | X | X | X | X | X | X | X | X | X |
The result being stored at register address 0x40021014
Put in simple words, the operation above does: “set bit number #17 of the register at address 0x40021014 to ‘1’ , and leave other bits as they are”
The value (0x01 <<17U) is called a positive mask in the logical bit-wise OR operation.
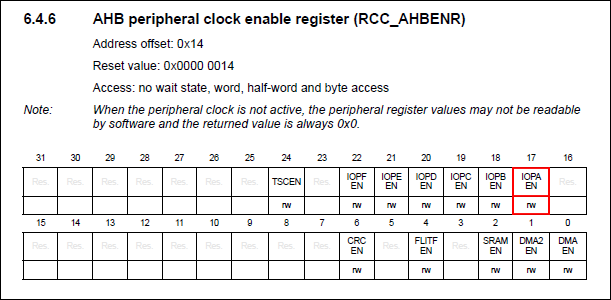
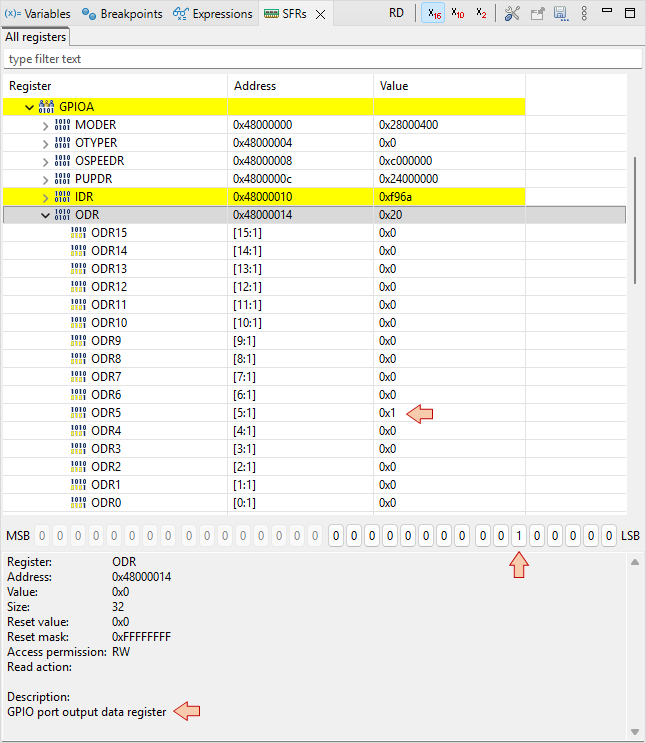
In the ![]() SFRs view, unfold the RCC AHBENR register at address 0x40021014. Then step-over
SFRs view, unfold the RCC AHBENR register at address 0x40021014. Then step-over ![]() once and watch the IOPAEN bit at location 17. It should toggle from 0 to 1. By selecting that particular bit in the SFRs view, you get a short description of what it does.
once and watch the IOPAEN bit at location 17. It should toggle from 0 to 1. By selecting that particular bit in the SFRs view, you get a short description of what it does.

You’ve just turned ON the clock of the General-Purpose Input Output (GPIO) pins associated to the port A (GPIOA). This is done in the Reset and Clock Control (RCC) peripheral.
You can find further information regarding this register in the Reference Manual:
- Why do we actually want to turn in the GPIOA clock?
- That's because this is the GPIO port A that drives the LED.
- How do we know that?
- By looking at the Nucleo board documentation and schematics:
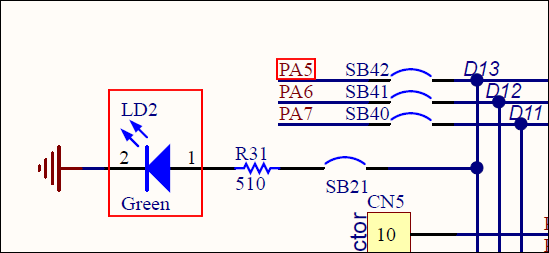
The LED is wired to the PA5 pin of the STM32 MCU. PA5 means "pin #5 of port A".
Next two lines concerns register at address 0x48000000:
*(int *)0x48000000 &= ~(0xC00);
*(int *)0x48000000 |= (0x01 <<10U);
0xC00 = 0x00000C00
| n | 31 | 30 | 29 | 28 | 27 | 26 | 25 | 24 | 23 | 22 | 21 | 20 | 19 | 18 | 17 | 16 | 15 | 14 | 13 | 12 | 11 | 10 | 9 | 8 | 7 | 6 | 5 | 4 | 3 | 2 | 1 | 0 |
| 0x | 0 | 0 | 0 | 0 | 0 | C | 0 | 0 | ||||||||||||||||||||||||
| 0 | 0 | 0 | 0 | 0 | 0 | 0 | 0 | 0 | 0 | 0 | 0 | 0 | 0 | 0 | 0 | 0 | 0 | 0 | 0 | 1 | 1 | 0 | 0 | 0 | 0 | 0 | 0 | 0 | 0 | 0 | 0 | |
| ~ | 1 | 1 | 1 | 1 | 1 | 1 | 1 | 1 | 1 | 1 | 1 | 1 | 1 | 1 | 1 | 1 | 1 | 1 | 1 | 1 | 0 | 0 | 1 | 1 | 1 | 1 | 1 | 1 | 1 | 1 | 1 | 1 |
Then
| n | 31 | 30 | 29 | 28 | 27 | 26 | 25 | 24 | 23 | 22 | 21 | 20 | 19 | 18 | 17 | 16 | 15 | 14 | 13 | 12 | 11 | 10 | 9 | 8 | 7 | 6 | 5 | 4 | 3 | 2 | 1 | 0 |
| R= | X | X | X | X | X | X | X | X | X | X | X | X | X | X | X | X | X | X | X | X | X | X | X | X | X | X | X | X | X | X | X | X |
| AND | 1 | 1 | 1 | 1 | 1 | 1 | 1 | 1 | 1 | 1 | 1 | 1 | 1 | 1 | 1 | 1 | 1 | 1 | 1 | 1 | 0 | 0 | 1 | 1 | 1 | 1 | 1 | 1 | 1 | 1 | 1 | 1 |
| R= | X | X | X | X | X | X | X | X | X | X | X | X | X | X | X | X | X | X | X | X | 0 | 0 | X | X | X | X | X | X | X | X | X | X |
| OR | 0 | 0 | 0 | 0 | 0 | 0 | 0 | 0 | 0 | 0 | 0 | 0 | 0 | 0 | 0 | 0 | 0 | 0 | 0 | 0 | 0 | 1 | 0 | 0 | 0 | 0 | 0 | 0 | 0 | 0 | 0 | 0 |
| R= | X | X | X | X | X | X | X | X | X | X | X | X | X | X | X | X | X | X | X | X | 0 | 1 | X | X | X | X | X | X | X | X | X | X |
In simple words, the operation is: “set bits [11 10] of register at address 0x48000000 to value ‘01’, leaving other bits as they are.”
Because leaving other bits unchanged requires a OR operation which can only set to '1' unmasked bits, we need first to reset all bits under interest to 0. That’s the purpose of the AND operation using ~(0xC00) as a negative mask.
Step-over ![]() the two lines and watch the GPIOA register MODER at address 0x48000000:
the two lines and watch the GPIOA register MODER at address 0x48000000:
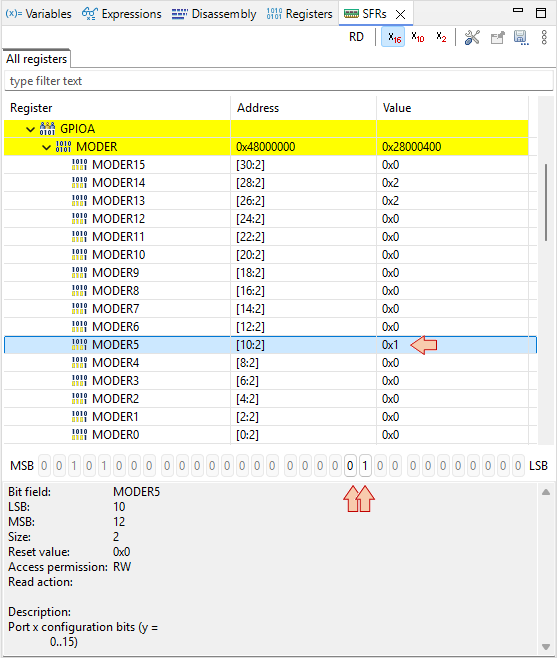
MODER is the register that defines the direction (input/output) of each MCU pins associated with GPIOs. What we’ve just done, is to set PA5 pin as an output. This is precisely what we need, in order to be able to drive the LED.
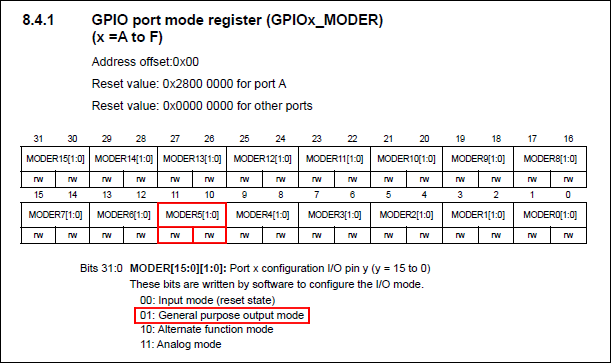
Note that if the GPIO clock is not started before (as we did), MODER cannot be written. Again, you can refer to Reference Manual to get detailed information regarding the MODER register:
2.3. Monitoring Memory
If everything goes well, the debugger is now stopped at the beginning of the infinite loop:
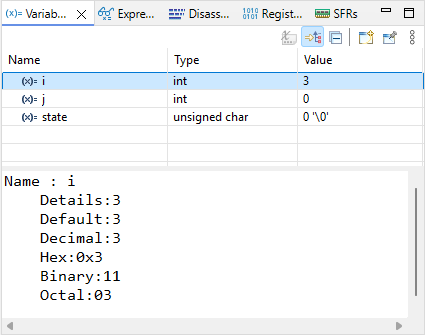
Press ![]() several times to verify that the switch statement behaves as expected (until i=3 for instance). Doing that, observe the values of state, i, j into the
several times to verify that the switch statement behaves as expected (until i=3 for instance). Doing that, observe the values of state, i, j into the ![]() Variables tab.
Variables tab.
Open the ![]() Memory view. Add
Memory view. Add ![]() a monitor &i. The memory viewer then shifts to display the location of i variable first (here at address 0x20003FF4).
a monitor &i. The memory viewer then shifts to display the location of i variable first (here at address 0x20003FF4).
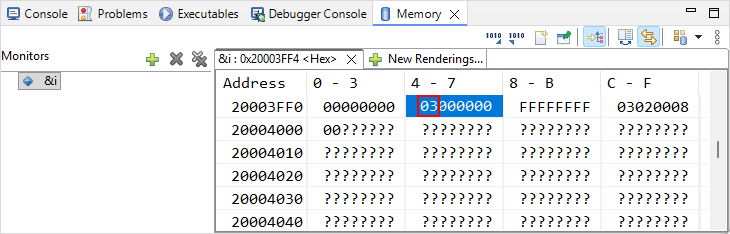
Step over ![]() the code another couple of times to see if the value of i correctly changes in both the Variables and Memory views.
the code another couple of times to see if the value of i correctly changes in both the Variables and Memory views.
Suppose now that we want to check that the switch statement works well when i variable reaches 100000. Obviously, it would take too much time (and pain) to manually step through the code until then.
There are at least 3 ways to achieve this much faster:
Change the value of i to something close to 100000 (eg 99999), in the Variables view
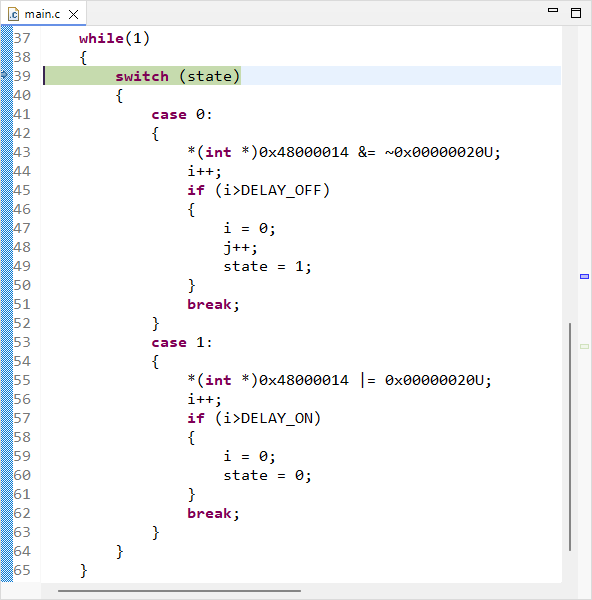
Position editing cursor on line 47 (first instruction when i>100000) and then use Run→Run To Line
 menu command
Set a breakpoint at line 47, and then press the run button

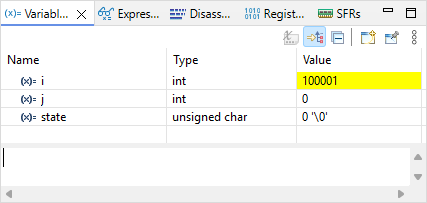
Let-us try the second method. Position editing cursor on line 47 (or the one that corresponds in your source code) and then use Run→Run To Line ![]() menu command. Watch the value of i in the
menu command. Watch the value of i in the ![]() Variables view. Should be 100001 now.
Variables view. Should be 100001 now.
Step-over ![]() the code another couple of times, looking at i, j and state variables and make sure things are behaving as expected (now looping through the state 1).
the code another couple of times, looking at i, j and state variables and make sure things are behaving as expected (now looping through the state 1).
Press the run ![]() button and verify that the LED is blinking in real time, as a normal code execution.
button and verify that the LED is blinking in real time, as a normal code execution.
Note that both ![]() Expressions and
Expressions and ![]() Variables views display variables. So why having both?
Variables views display variables. So why having both?
The
 Variables view automatically displays variables that are local to the function being debugged at a given time. It is not able to display global variables.
The
 Expressions view is where you can display global variables and expressions based on variables.
2.4. Using Breakpoints
Suspend the debugger ![]()
The code line pointer is somewhere in the main loop, depending on when you pressed the pause button. Let us assume that we want to stop the code execution each time there is a change in the LED state. We can do that with breakpoints.
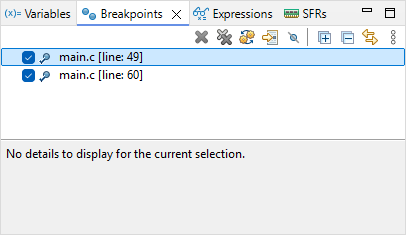
Double-click in the vertical blue lane (on the left of the main editor frame) at line 49 and line 60. You have set two breakpoints, right before LED state changes:
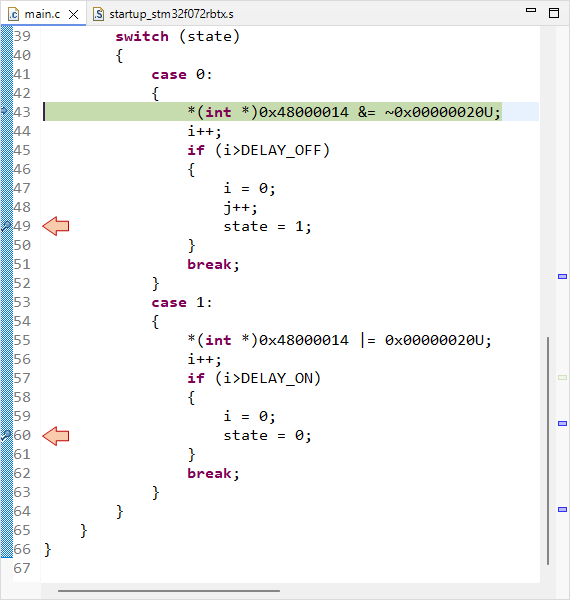
Now the LED state should toggle every time you press ![]() , alternatively stopping program execution on either breakpoints. Note that breakpoints are a limited hardware feature of the MCU. STM32F072 offers up to 4 breakpoints. You cannot set as many breakpoints you want.
, alternatively stopping program execution on either breakpoints. Note that breakpoints are a limited hardware feature of the MCU. STM32F072 offers up to 4 breakpoints. You cannot set as many breakpoints you want.
Info : stm32f0x.cpu: hardware has 4 breakpoints, 2 watchpoints
You can view and manage active breakpoints using the Breakpoints view :
We can't leave this tutorial without a look on the two code lines that actually change the LED state, would we ?
The LED is turned on by:
*(int *)0x48000014 |= 0x00000020U;- 0x00000020 (hex) is equivalent to 0000 0000 0000 0000 0000 0000 0010 0000 (binary). That is a '1' at the 5th position.
- 0x48000014 is the address of the ODR (Output Data Register) register of GPIOA.
So this code simply writes a '1' on bit #5 of the ODR register, of the GPIOA peripheral.
The same way, the LED is turned off by:
*(int *)0x48000014 &= ~0x00000020U;
Well done, you may terminate the debug session ![]() .
.
3. Summary
This tutorial is an overview of the most useful features of the debugger. Debugging is an essential process that you should get familiar with. No new code (even apparently working) should be released without a deep check (line by line) under debugger. You’ll be surprised.