
In these tutorials, we will make intensive use a commercial tool to illustrate FreeRTOS mechanisms. This tool is Tracealyzer® from Percepio®.

You may take some time to visit Percepio® website:
- Tracealyzer main page
- Tracealyzer for FreeRTOS user manual
If you cannot get access to a Tracealyzer license (sorry for you), you may skip this tutorial. Otherwise, and if you want to be able to record and analyze what's happening in your FreeRTOS projects, you are highly encouraged to setup your project in order to get those OS traces. That's really helpful, and highly instructive.
The only thing you need to know at the moment is that tracing OS events requires two pieces of software:
- The recorder is running on your target MCU while OS is executing. It captures and records events at runtime in a memory buffer . It is provided as a set of source files (just like FreeRTOS) you need to include and configure in your MCU project.
- The Tracealyzer is a computer application which provides visual tools to help analyze OS behavior based on stored events.
There are two methods for transferring events stored in the MCU memory to the Tracealyzer computer application:
- Using a memory dump from the debugger while program execution is suspended (snapshot mode)
- Using a real-time streaming while program executes (streaming mode)
This tutorial only covers the snapshot mode.
The user manual provides detailed instructions on how to get Tracealyzer working with your project. In particular, see the Integrating the Recorder section. At time of writing, Tracealyzer version is 4.5.0.
1. Integrating the Recorder
We're not going here into the details that are well covered by the Percepio user manual. Let us just review the main steps.
1.1. Getting the Recorder source files into your project
You may get recorder source files from two locations:
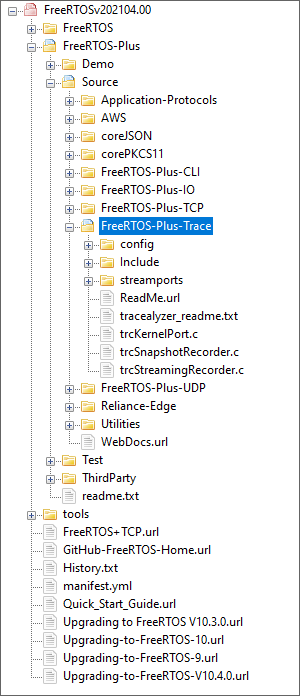
- The FreeRTOS archive comes with various addons including the Percepio recorder source files. These are located in FreeRTOS-Plus\Source\FreeRTOS-Plus-Trace\ folder.
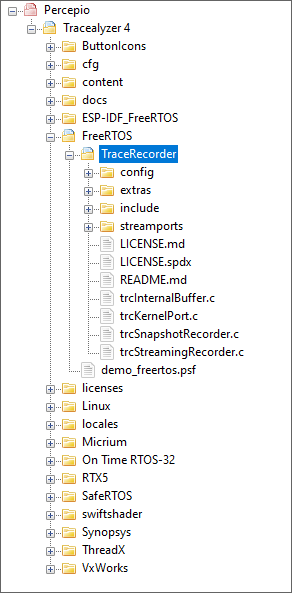
- After you have downloaded and installed Percepio Tracealyzer on your computer, you'll find the recorder source files in the installation directory (e.g. C:\Program Files\Percepio\Tracealyzer 4\FreeRTOS\TraceRecorder\).
Be aware that even if you get last version of both, there might be a difference in the recorder version. I guess that it is better to match the recorder and Tracealyzer versions, although it is likely that a slightly older recorder will work fine with a newer version of Tracealyzer. You can open \include\trcRecorder.h for instance to check the recorder version.
| FreeRTOS archive | Percepio installation folder (e.g. Program Files) |
 |
 |
|
\include\trcRecorder.h
|
\include\trcRecorder.h
|
After you've located the recorder source files on your computer, create a new source folder ![]() 'TraceRecorder' in your project structure and Copy/Paste source files as follow:
'TraceRecorder' in your project structure and Copy/Paste source files as follow:
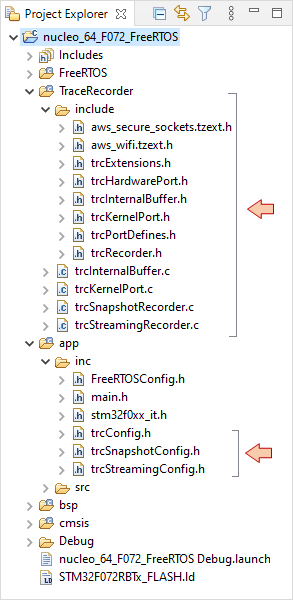
Note that some cleaning has been done in order to only keep what is useful considering your target and debug probe:
- The 3 configuration headers have been moved into app\inc\ folder
- streamports are not necessary for now (maybe later...) as we will use the snapshot mode.
- text files (.txt) have been removed
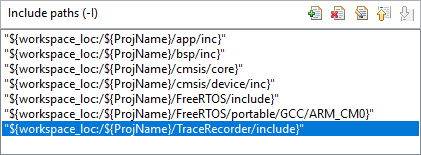
Next, add the TraceRecorder\include\ path to the build configuration and apply changes:
1.2. Configuring the Recorder
Open FreeRTOSConfig.h:
- Turn on the configUSE_TRACE_FACILITY flag:
/*-----------------------------------------------------------
 * Application specific definitions.
 *
 * These definitions should be adjusted for your particular hardware and
 * application requirements.
 *
 * THESE PARAMETERS ARE DESCRIBED WITHIN THE 'CONFIGURATION' SECTION OF THE
 * FreeRTOS API DOCUMENTATION AVAILABLE ON THE FreeRTOS.org WEB SITE.
 *
 * See http://www.freertos.org/a00110.html.
 *----------------------------------------------------------*/

#define configUSE_PREEMPTION			1
#define configUSE_IDLE_HOOK			0
#define configUSE_TICK_HOOK			0
#define configCPU_CLOCK_HZ			( 48000000UL )
#define configTICK_RATE_HZ			( ( TickType_t ) 1000 )
#define configMAX_PRIORITIES			( 5 )
#define configMINIMAL_STACK_SIZE		( ( unsigned short ) 70 )
#define configTOTAL_HEAP_SIZE			( ( size_t ) ( 7 * 1024 ) )
#define configMAX_TASK_NAME_LEN			( 10 )
#define configUSE_TRACE_FACILITY		1          // <-- Set this flag
#define configUSE_16_BIT_TICKS			0
#define configIDLE_SHOULD_YIELD			1
#define configUSE_MUTEXES			1
#define configQUEUE_REGISTRY_SIZE		0
#define configGENERATE_RUN_TIME_STATS	        0
#define configCHECK_FOR_STACK_OVERFLOW	        0
#define configUSE_RECURSIVE_MUTEXES		0
#define configUSE_MALLOC_FAILED_HOOK	        0
#define configUSE_APPLICATION_TASK_TAG	        0
#define configUSE_COUNTING_SEMAPHORES	        0
- Then add the following at the very end of FreeRTOSConfig.h:
...

/* Integrates the Tracealyzer recorder with FreeRTOS */
#if ( configUSE_TRACE_FACILITY == 1 )
#include "trcRecorder.h"
#endif

#endif /* FREERTOS_CONFIG_H */
Now open trcConfig.h:
- Add the device header:
/******************************************************************************
 * Include of processor header file
 *
 * Here you may need to include the header file for your processor. This is
 * required at least for the ARM Cortex-M port, that uses the ARM CMSIS API.
 * Try that in case of build problems. Otherwise, remove the #error line below.
 *****************************************************************************/
// #error "Trace Recorder: Please include your processor's header file here and remove this line."
#include "stm32f0xx.h"
- Then select the Cortex-M hardware port:
/*******************************************************************************
 * Configuration Macro: TRC_CFG_HARDWARE_PORT
 *
 * Specify what hardware port to use (i.e., the "timestamping driver").
 *
 * All ARM Cortex-M MCUs are supported by "TRC_HARDWARE_PORT_ARM_Cortex_M".
 * This port uses the DWT cycle counter for Cortex-M3/M4/M7 devices, which is
 * available on most such devices. In case your device don't have DWT support,
 * you will get an error message opening the trace. In that case, you may
 * force the recorder to use SysTick timestamping instead, using this define:
 *
 * #define TRC_CFG_ARM_CM_USE_SYSTICK
 *
 * For ARM Cortex-M0/M0+ devices, SysTick mode is used automatically.
 *
 * See trcHardwarePort.h for available ports and information on how to
 * define your own port, if not already present.
 ******************************************************************************/
#define TRC_CFG_HARDWARE_PORT TRC_HARDWARE_PORT_ARM_Cortex_M
- Make sure that the recorder is set for snapshot mode:
/*******************************************************************************
 * Configuration Macro: TRC_CFG_RECORDER_MODE
 *
 * Specify what recording mode to use. Snapshot means that the data is saved in
 * an internal RAM buffer, for later upload. Streaming means that the data is
 * transferred continuously to the host PC.
 *
 * For more information, see http://percepio.com/2016/10/05/rtos-tracing/
 * and the Tracealyzer User Manual.
 *
 * Values:
 * TRC_RECORDER_MODE_SNAPSHOT
 * TRC_RECORDER_MODE_STREAMING
 ******************************************************************************/
#define TRC_CFG_RECORDER_MODE TRC_RECORDER_MODE_SNAPSHOT
- Then adapt the following to your FreeRTOS version:
/******************************************************************************
 * TRC_CFG_FREERTOS_VERSION
 *
 * Specify what version of FreeRTOS that is used (don't change unless using the
 * trace recorder library with an older version of FreeRTOS).
 *
 * TRC_FREERTOS_VERSION_7_3_X				If using FreeRTOS v7.3.X
 * TRC_FREERTOS_VERSION_7_4_X				If using FreeRTOS v7.4.X
 * TRC_FREERTOS_VERSION_7_5_X				If using FreeRTOS v7.5.X
 * TRC_FREERTOS_VERSION_7_6_X				If using FreeRTOS v7.6.X
 * TRC_FREERTOS_VERSION_8_X_X				If using FreeRTOS v8.X.X
 * TRC_FREERTOS_VERSION_9_0_0				If using FreeRTOS v9.0.0
 * TRC_FREERTOS_VERSION_9_0_1				If using FreeRTOS v9.0.1
 * TRC_FREERTOS_VERSION_9_0_2				If using FreeRTOS v9.0.2
 * TRC_FREERTOS_VERSION_10_0_0				If using FreeRTOS v10.0.0
 * TRC_FREERTOS_VERSION_10_0_1				If using FreeRTOS v10.0.1
 * TRC_FREERTOS_VERSION_10_1_0				If using FreeRTOS v10.1.0
 * TRC_FREERTOS_VERSION_10_1_1				If using FreeRTOS v10.1.1
 * TRC_FREERTOS_VERSION_10_2_0				If using FreeRTOS v10.2.0
 * TRC_FREERTOS_VERSION_10_2_1				If using FreeRTOS v10.2.1
 * TRC_FREERTOS_VERSION_10_3_0				If using FreeRTOS v10.3.0
 * TRC_FREERTOS_VERSION_10_3_1				If using FreeRTOS v10.3.1
 * TRC_FREERTOS_VERSION_10_4_0				If using FreeRTOS v10.4.0
 * TRC_FREERTOS_VERSION_10_4_1				If using FreeRTOS v10.4.1 or later
 *****************************************************************************/
#define TRC_CFG_FREERTOS_VERSION TRC_FREERTOS_VERSION_10_4_1
- Remove the OS tick events from the record, as it uses a lot of RAM... and we have very little...
 /*****************************************************************************
 * TRC_CFG_INCLUDE_OSTICK_EVENTS
 *
 * Macro which should be defined as either zero (0) or one (1).
 *
 * If this is one (1), events will be generated whenever the OS clock is
 * increased. If zero (0), OS tick events are not generated, which allows for
 * recording longer traces in the same amount of RAM.
 *
 * Default value is 1.
 *****************************************************************************/
#define TRC_CFG_INCLUDE_OSTICK_EVENTS 0
Finally, open trcSnapshotConfig.h and check the following.
- Let-us record the beginning of the OS life:
/******************************************************************************
 * TRC_CFG_SNAPSHOT_MODE
 *
 * Macro which should be defined as one of:
 * - TRC_SNAPSHOT_MODE_RING_BUFFER
 * - TRC_SNAPSHOT_MODE_STOP_WHEN_FULL
 * Default is TRC_SNAPSHOT_MODE_RING_BUFFER.
 *
 * With TRC_CFG_SNAPSHOT_MODE set to TRC_SNAPSHOT_MODE_RING_BUFFER, the
 * events are stored in a ring buffer, i.e., where the oldest events are
 * overwritten when the buffer becomes full. This allows you to get the last
 * events leading up to an interesting state, e.g., an error, without having
 * to store the whole run since startup.
 *
 * When TRC_CFG_SNAPSHOT_MODE is TRC_SNAPSHOT_MODE_STOP_WHEN_FULL, the
 * recording is stopped when the buffer becomes full. This is useful for
 * recording events following a specific state, e.g., the startup sequence.
 *****************************************************************************/
#define TRC_CFG_SNAPSHOT_MODE TRC_SNAPSHOT_MODE_STOP_WHEN_FULL
- Keep the default buffer size to 1000 events (4kB):
/*******************************************************************************
 * TRC_CFG_EVENT_BUFFER_SIZE
 *
 * Macro which should be defined as an integer value.
 *
 * This defines the capacity of the event buffer, i.e., the number of records
 * it may store. Most events use one record (4 byte), although some events
 * require multiple 4-byte records. You should adjust this to the amount of RAM
 * available in the target system.
 *
 * Default value is 1000, which means that 4000 bytes is allocated for the
 * event buffer.
 ******************************************************************************/
#define TRC_CFG_EVENT_BUFFER_SIZE 1000
- Lower the number of maximum kernel objects under monitoring. This will save some RAM:
/*******************************************************************************
 * TRC_CFG_NTASK, TRC_CFG_NISR, TRC_CFG_NQUEUE, TRC_CFG_NSEMAPHORE...
 *
 * A group of macros which should be defined as integer values, zero or larger.
 *
 * These define the capacity of the Object Property Table, i.e., the maximum
 * number of objects active at any given point, within each object class (e.g.,
 * task, queue, semaphore, ...).
 *
 * If tasks or other objects are deleted in your system, this
 * setting does not limit the total amount of objects created, only the number
 * of objects that have been successfully created but not yet deleted.
 *
 * Using too small values will cause vTraceError to be called, which stores an
 * error message in the trace that is shown when opening the trace file. The
 * error message can also be retrieved using xTraceGetLastError.
 *
 * It can be wise to start with large values for these constants,
 * unless you are very confident on these numbers. Then do a recording and
 * check the actual usage by selecting View menu -> Trace Details ->
 * Resource Usage -> Object Table.
 ******************************************************************************/
#define TRC_CFG_NTASK			8
#define TRC_CFG_NISR			4
#define TRC_CFG_NQUEUE			4
#define TRC_CFG_NSEMAPHORE		6
#define TRC_CFG_NMUTEX			2
#define TRC_CFG_NTIMER			2
#define TRC_CFG_NEVENTGROUP		2
#define TRC_CFG_NSTREAMBUFFER	        2
#define TRC_CFG_NMESSAGEBUFFER	        2
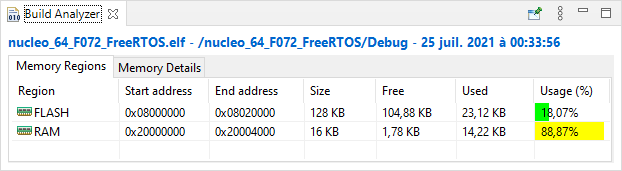
Save all ![]() and make sure that the project builds
and make sure that the project builds ![]() without any error or warnings.
without any error or warnings.
Finished building target: nucleo_64_F072_FreeRTOS.elf

arm-none-eabi-size   nucleo_64_F072_FreeRTOS.elf
   text	   data	    bss	    dec	    hex	filename
  23648	     32	  14536	  38216	   9548	nucleo_64_F072_FreeRTOS.elf
Finished building: default.size.stdout

arm-none-eabi-objdump -h -S  nucleo_64_F072_FreeRTOS.elf  > "nucleo_64_F072_FreeRTOS.list"
Finished building: nucleo_64_F072_FreeRTOS.list

arm-none-eabi-objcopy  -O binary  nucleo_64_F072_FreeRTOS.elf  "nucleo_64_F072_FreeRTOS.bin"
Finished building: nucleo_64_F072_FreeRTOS.bin

00:33:56 Build Finished. 0 errors, 0 warnings. (took 6s.174ms)
You should take care of the reported level of bss memory since it includes the amount of memory that we reserved for both the FreeRTOS heap (7kB) and for the recorder (4kB). Remember that STM32F072 only features 16kB of RAM. Here, it's almost full...
Fortunately, the linker won't build if you exceed the amount of available RAM. You can try and double the recorder capacity for instance:
#define TRC_CFG_EVENT_BUFFER_SIZE 2000
and you'll see:
c:\stm\...\ld.exe: nucleo_64_F072_FreeRTOS.elf section `.bss' will not fit in region `RAM'
c:\stm\...\ld.exe: region `RAM' overflowed by 2176 bytes
collect2.exe: error: ld returned 1 exit status
make: *** [makefile:69: nucleo_64_F072_FreeRTOS.elf] Error 1
"make all" terminated with exit code 2. Build might be incomplete.
Then go back to 1000...
2. Recording OS events
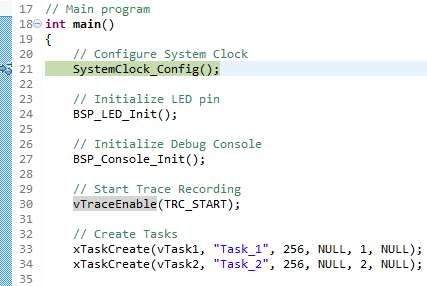
The first step is to start the record process somewhere in the program. If you want to catch all the FreeRTOS events from the startup, then start the recorder before any call to any FreeRTOS API function. In our case, edit main() as follows:
// Main program
int main()
{
	// Configure System Clock
	SystemClock_Config();

	// Initialize LED pin
	BSP_LED_Init();

	// Initialize Debug Console
	BSP_Console_Init();

	// Start Trace Recording
	vTraceEnable(TRC_START);

	// Create Tasks
	xTaskCreate(vTask1, "Task_1", 256, NULL, 1, NULL);
	xTaskCreate(vTask2, "Task_2", 256, NULL, 2, NULL);

	// Start the Scheduler
	vTaskStartScheduler();

	while(1)
	{
		// The program should never be here...
	}
}
Then, let us speed things up in vTask1() and vTask2() in order to get more recorded events in a short time window. Set the LED toggle period to 30ms, and the message display every 100ms.
/*
 *	Task1 toggles LED every 30ms
 */
void vTask1 (void *pvParameters)
{
	while(1)
	{
		BSP_LED_Toggle();
		vTaskDelay(30);
	}
}

/*
 *	Task2 sends a message to console every 100ms
 */
void vTask2 (void *pvParameters)
{
	uint16_t count;

	count = 0;

	while(1)
	{
		my_printf("Hello %2d from task2\r\n", count);
		count++;
		vTaskDelay(100);
	}
}
Save all ![]() , make sure that the project still builds
, make sure that the project still builds ![]() without any error or warnings.
without any error or warnings.
 |
 Commit name "Trace recorder" Commit name "Trace recorder" Push onto Gitlab Push onto Gitlab |
Launch a debug session ![]() . You should get the debugger waiting at the beginning of main():
. You should get the debugger waiting at the beginning of main():
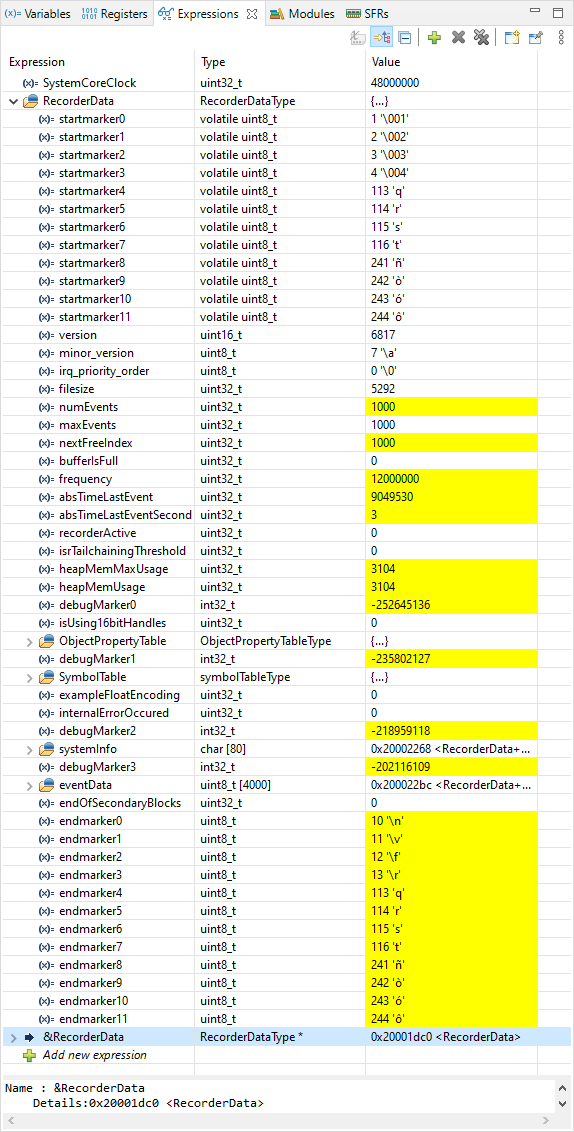
Locate the RecorderData global variable in the processor memory. RecorderData is actually a structure of data you can display using the Expressions view. You also get its address by displaying &RecorderData.
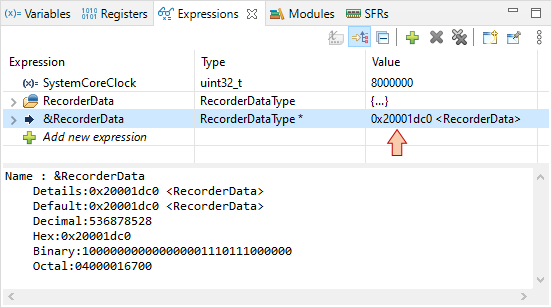
The above tells us that RecorderData is located at address 0x20001dc0 in memory.
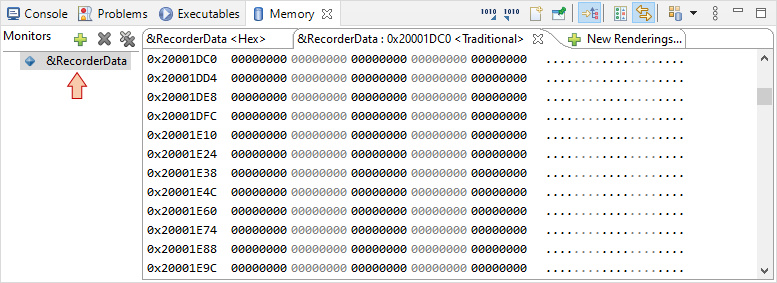
Alternately, you can add ![]() a memory Monitor in the Memory view:
a memory Monitor in the Memory view:
Step over ![]() the code until you pass the vTraceEnable() function and take a look (unfold) the RecorderData structure in the Expression view. You'll see that a lot of initializations have been performed. Notice that numEvents member is set to 1. Then step over
the code until you pass the vTraceEnable() function and take a look (unfold) the RecorderData structure in the Expression view. You'll see that a lot of initializations have been performed. Notice that numEvents member is set to 1. Then step over ![]() again the two xTaskCreate() functions while watching the numEvents member. You'll see that a task creation corresponds to 8 events in the recorder.
again the two xTaskCreate() functions while watching the numEvents member. You'll see that a task creation corresponds to 8 events in the recorder.
Now, just run the program ![]() , wait a little while (a couple of seconds) and then click the suspend
, wait a little while (a couple of seconds) and then click the suspend ![]() button. How high is the numEvent variable ? If it reached 1000, that means that recorder is full, and that it doesn't record anything anymore.
button. How high is the numEvent variable ? If it reached 1000, that means that recorder is full, and that it doesn't record anything anymore.
At this step, we have a very valuable information stored in the recorder memory, but it's not human-readable in its current form:
That's where Tracealyzer comes into the game.
3. Analyzing the trace
3.1. Dump the memory into a file on the host computer
While the debugger is still in the suspended state, click the ![]() Export button in the
Export button in the ![]() Memory view. Then fill up the popup window:
Memory view. Then fill up the popup window:
- Select RAW Binary as export Format
- Make sure that Start address is the one of the RecorderData structure you got above (0x20001dc0)
- Set the Length to anything bigger than the expected recorder length (4000 bytes of events + other fields) → say 10000
- Give a simple name such as ram.bin to the destination file
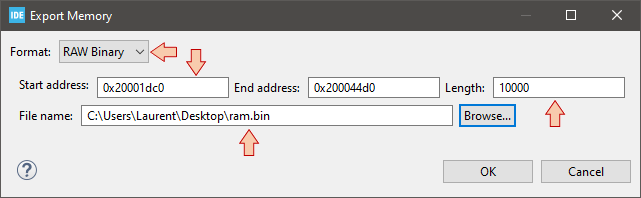
Then click OK. You should get a file ram.bin created on your computer, which is a copy of the actual STM32 memory content.
3.2. Open the memory dump into Tracealyzer®
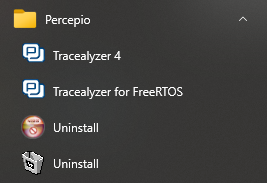
From Windows launch menu, start Tracealyzer.
Within Tracealyzer, select File →Open→Open File and browse to ram.bin. You can also just drag and drop the ram.bin file into the Tracealyzer window. The trace opens...
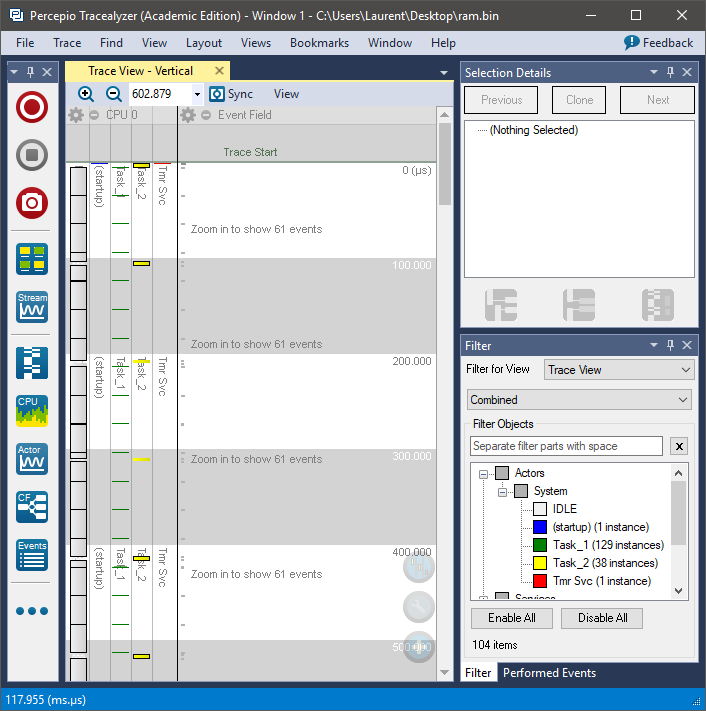
On the left, vertical lanes represent the system tasks execution along a vertical time line. Task priority is increasing from left to right. You can scroll and zoom into this view using the mouse wheel and use right filters to display various information.
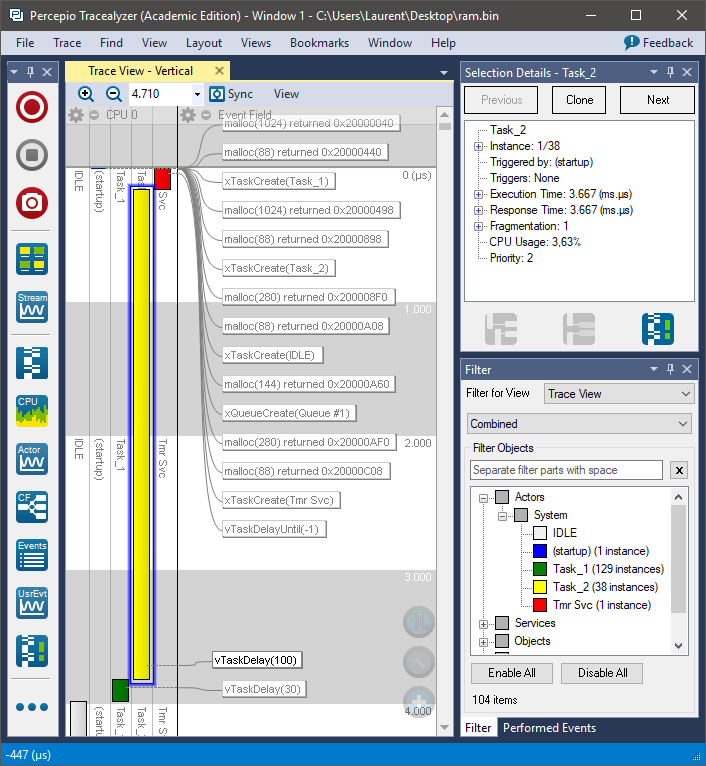
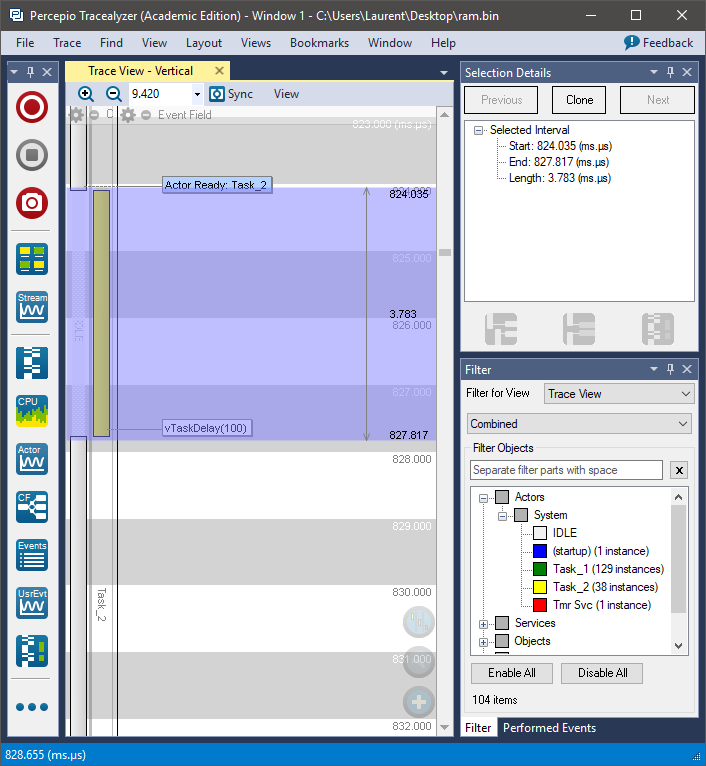
You can measure time by click-dragging the mouse in the main view:
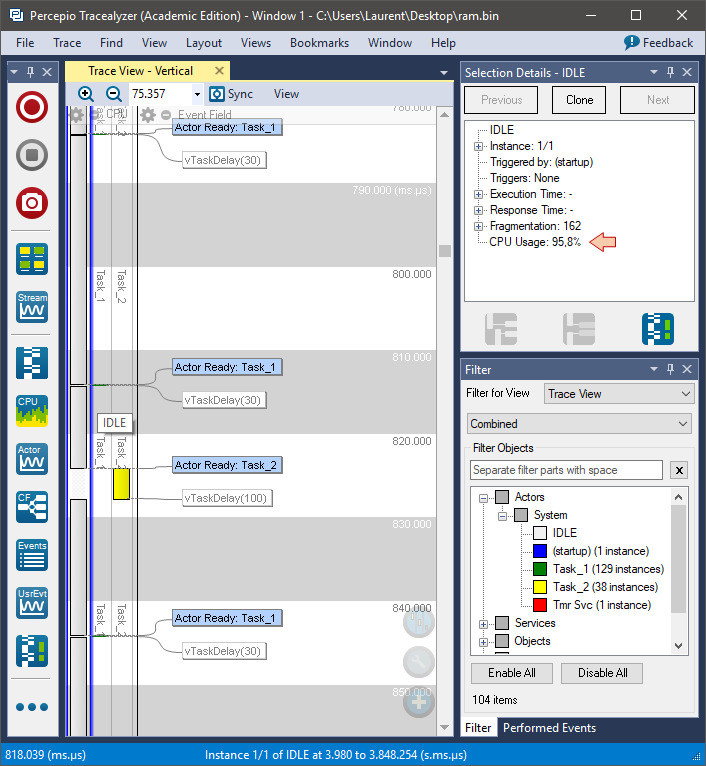
Selecting the task IDLE (left lane), you get an idea of the CPU load. In the figure below, the IDLE task is running 97.9% of time. In other words, the CPU is only busy with our Task_1 and Task_2 for 2.1% of the time.
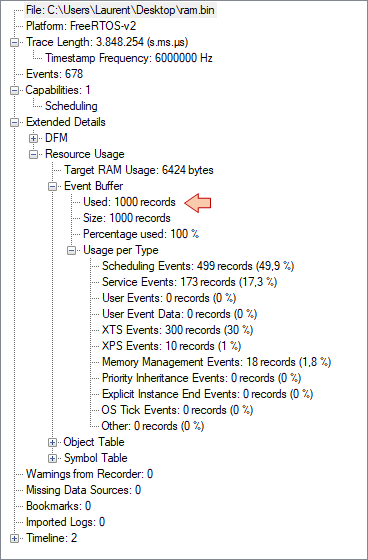
Using the View menu, you get access to more information. Open for instance View→Trace Overview. This view provides a summary of the recorder trace. You can see that 1000 events have been recorded in 3.8s. If you need longer traces, you need a larger recorder buffer, which is difficult with a limited amount of RAM.
Now try and open Views → Actor Instance Graphs → Wait time. You get a view of waiting time for each task. The waiting time corresponds to the time a task waits, from the moment it is ready to execute, to the moment it actually runs. In the graph below, one can see that Task_2 (yellow) never waits. That's fortunate, because Task_2 is of highest priority. Task_1 (green) wait time is also zero most of the time, but by 3 times within the record window, it had to wait about 2ms before being executed.
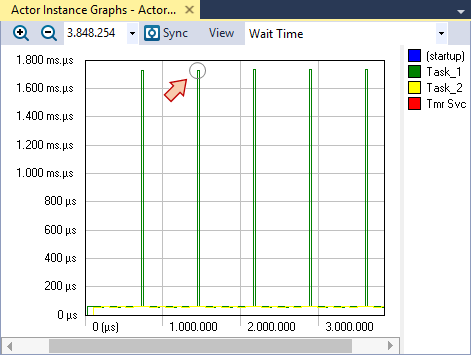
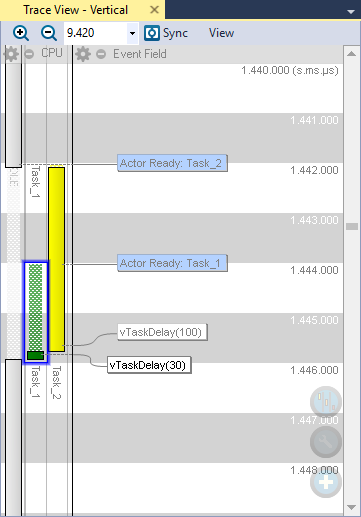
Double-clicking the point of interest in the above view align all the Tracealyzer opened views so that you can get a better understanding of the local situation. In this case, we understand that, at regular time interval, both Task_1 and Task_2 are simultaneously ready. Task_2 has higher priority, therefore Task_1 waits for the CPU to be available (i.e. until Task_2 terminates).
4. Using Percepio Eclipse plugin
The process of memory dumping and loading of Tracealyzer is not difficult, but it can be made even easier using a Percepio plugin within STM32CubeIDE.
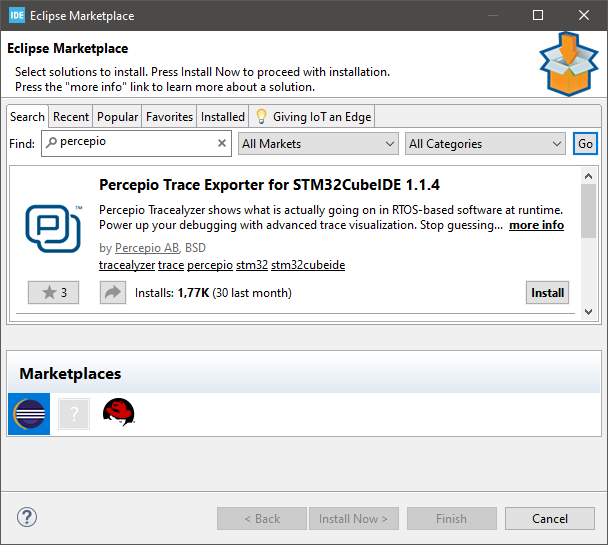
Open Help → ![]() Eclipse Marketplace... and search for percepio plugins. Then install the Trace Exporter for STM32CubeIDE.
Eclipse Marketplace... and search for percepio plugins. Then install the Trace Exporter for STM32CubeIDE.
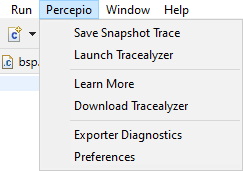
When done, you'll need to restart the IDE. Note that a new Percepio entry has been added in the top menu:
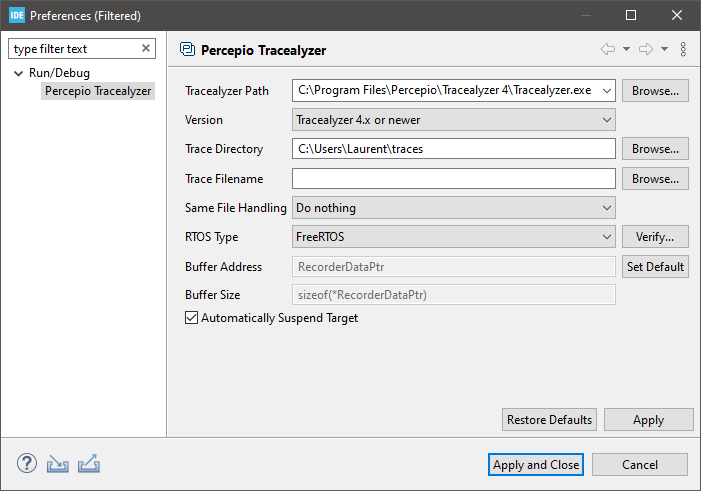
Go to Percepio → Preferences and review the settings, in particular the Tracealyzer Path.
When done, the process for loading a trace into Tracealyzer is as simple as:
- Start a debug session

- Run the program for a little while
 to let the recorder capture some events
 - Suspend execution

- Go to Percepio → Save Snapshot Trace. It opens Tracealyzer and loads the last recorded events automatically.
Add new comment